

Consumer Spending Rising While Freight Stagnates
“So goes transportation, so goes the economy” is a common refrain, but is that so? Yes, transportation carries the economy, and the economy depends on transportation. That transportation includes the floating and rolling assets that carry the raw ingredients of the economy and the stuff that consumers buy, throw away and buy again—both non-durable and durable goods.
The consumer in the United States is on a never-ending buying spree, it seems. Based on the latest Personal Consumer Expenditures report for March 2024, those consumers spent a record $19.4 trillion during that month. That spending is up more than one trillion dollars or 6 percent from the previous March. This measure, the PCE, is watched closely by the members of the Federal Reserve, and it influences their decision whether to raise, lower or keep the Fed fund rate as it is. If the PCE is rising fast, that suggests to them the economy is too hot and needs to cool down with higher rates, and conversely, if spending is slow or slowing, the economy needs stoking with lower rates.
Consumer spending is important to the U.S., being seven-tenths of the economy. But are the consumers spending their money on hard products that need to be transported? The answer would seem obvious, but it is not. Consumer spending includes two buckets: goods and services. Goods are the “hard” products that include durable (vehicles, refrigerators, furniture, or things that will last several years) and non-durable products (food and beverages, clothing, gasoline, personal care supplies or things that have a short lifespan or are consumed in a brief period). Expenditures on goods during March totaled $6.3 trillion or one-third of consumer spending.
Services, on the other hand, include housing, utilities, healthcare, transportation services (public transport for example), recreation including sporting events and gambling, lodging, financial services and other such activities. In March, spending on services totaled $13.0 trillion, two-thirds of consumer spending.
Expenditures on services are huge, and they are increasing at an accelerating pace, especially on healthcare. Since the COVID-19 pandemic recalibrated spending patterns, spending on services has increased an average of eight-tenths of 1 percent per month.
Spending More, Getting Less
Looking at the volume of freight transported around the United States would make one wonder what the consumers are spending their hard-earned money on. As just outlined, they are spending less on the “hard” products that need to be moved and more on services. The freight transportation services index of the United States reflects this slowing pace of spending on hard stuff, and more so. Cargo volumes have plateaued and are stagnating if not declining as depicted in the accompanying chart.
One would think cargo volumes would keep pace with consumer spending, but the volumes peaked at an all-time high during August 2022 at an index reading of 141.3. Since then, volumes have weakened and are showing no breakout to the upside.
While the consumer has spent more on hard goods, the reality is inflation has deflated movements. That is, as consumers spend more on hard stuff, they have less to show for it. Inflation has been compounding at an increasing rate since COVID-19 and still has legs to run. Until inflation settles and consumers have confidence in the economy, the spending on hard stuff will lag.
Granted, the volume of stuff moved across the economy of the United States was peaking before COVID-19, which curtailed movements dramatically. The climb out of COVID-19 roared life into the transportation sectors, but as said earlier, it lost steam with inflation and competition for the raw resources the United States uses domestically (such as coal due to emission regulations and lower-priced natural gas) or sends to the export market (including grain, soybeans, etc.). The transportation services index is a proxy of the volume of commodities, products and goods transported in the United States to support the economy.
Barging In, But Down
While the inland barge market does not move all the “hard” goods the consumer buys every day, it does move the raw ingredients for those products and goods manufactured or further processed in the United States and around the world. As discussed in the last Horizons column, barge loadings and movements are cyclical and seasonal. The average monthly volumes of internal domestic barge movements during January and February of this year are off to the slowest start since 2014, averaging 43.6 million short tons each month. While it is early in the calendar year, and there is still time to regain ground, headwinds are curtailing any breakout in a volume surge moved by barge, let alone across the other modes.
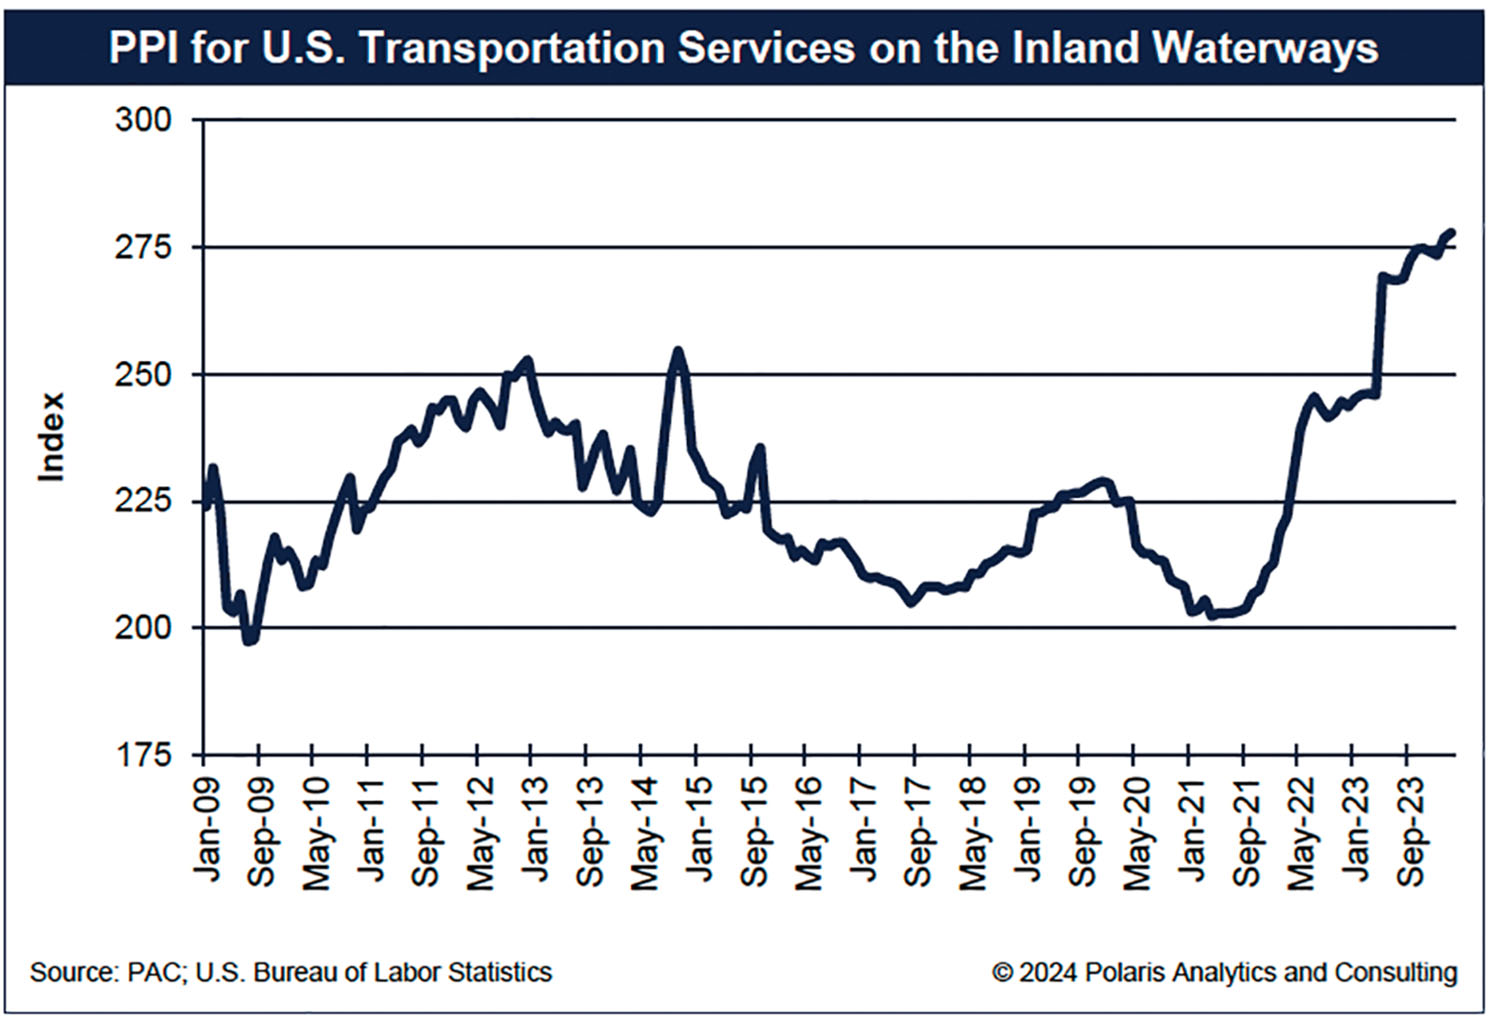
Despite the pullback on volumes moved by barge, the price paid for barge service has not shown any similarity to the fluctuations and downdraft on volumes. The PPI for barge service surged nearly 40 percent from its recent index low of about 200 in early January 2021 to a record index of 278 in March of this year as shown in the accompanying chart.
Understanding and determining barge freight rates is more art than science since many variables are at play, including barge supply and demand, equipment utilization levels, low and high water, the timing of demand, the location of equipment, weather events and disasters, government policy and regulation, etc. The inland industry endured dramatic low-water events the past two years that increased operating costs and led to higher rates.
Consumer spending will continue to surge higher with the hard products being less of a contributor to growth. Freight flow growth will be constrained if consumers slow their purchases as inflation chews away at the volumes available to be moved. Lastly, transportation purchasing, especially for inland waterway service, will remain volatile with higher peaks.
At this time in history, it might be better said, so goes inflation, so goes the economy.