

New Red River Navigation Tool Introduced
Operators and stakeholders of the J. Bennett Johnston Waterway, the federally maintained navigable channel on the Red River, have a new navigational tool at their fingertips, thanks to a new graphic produced by the Vicksburg Engineer District’s Water Control Office.
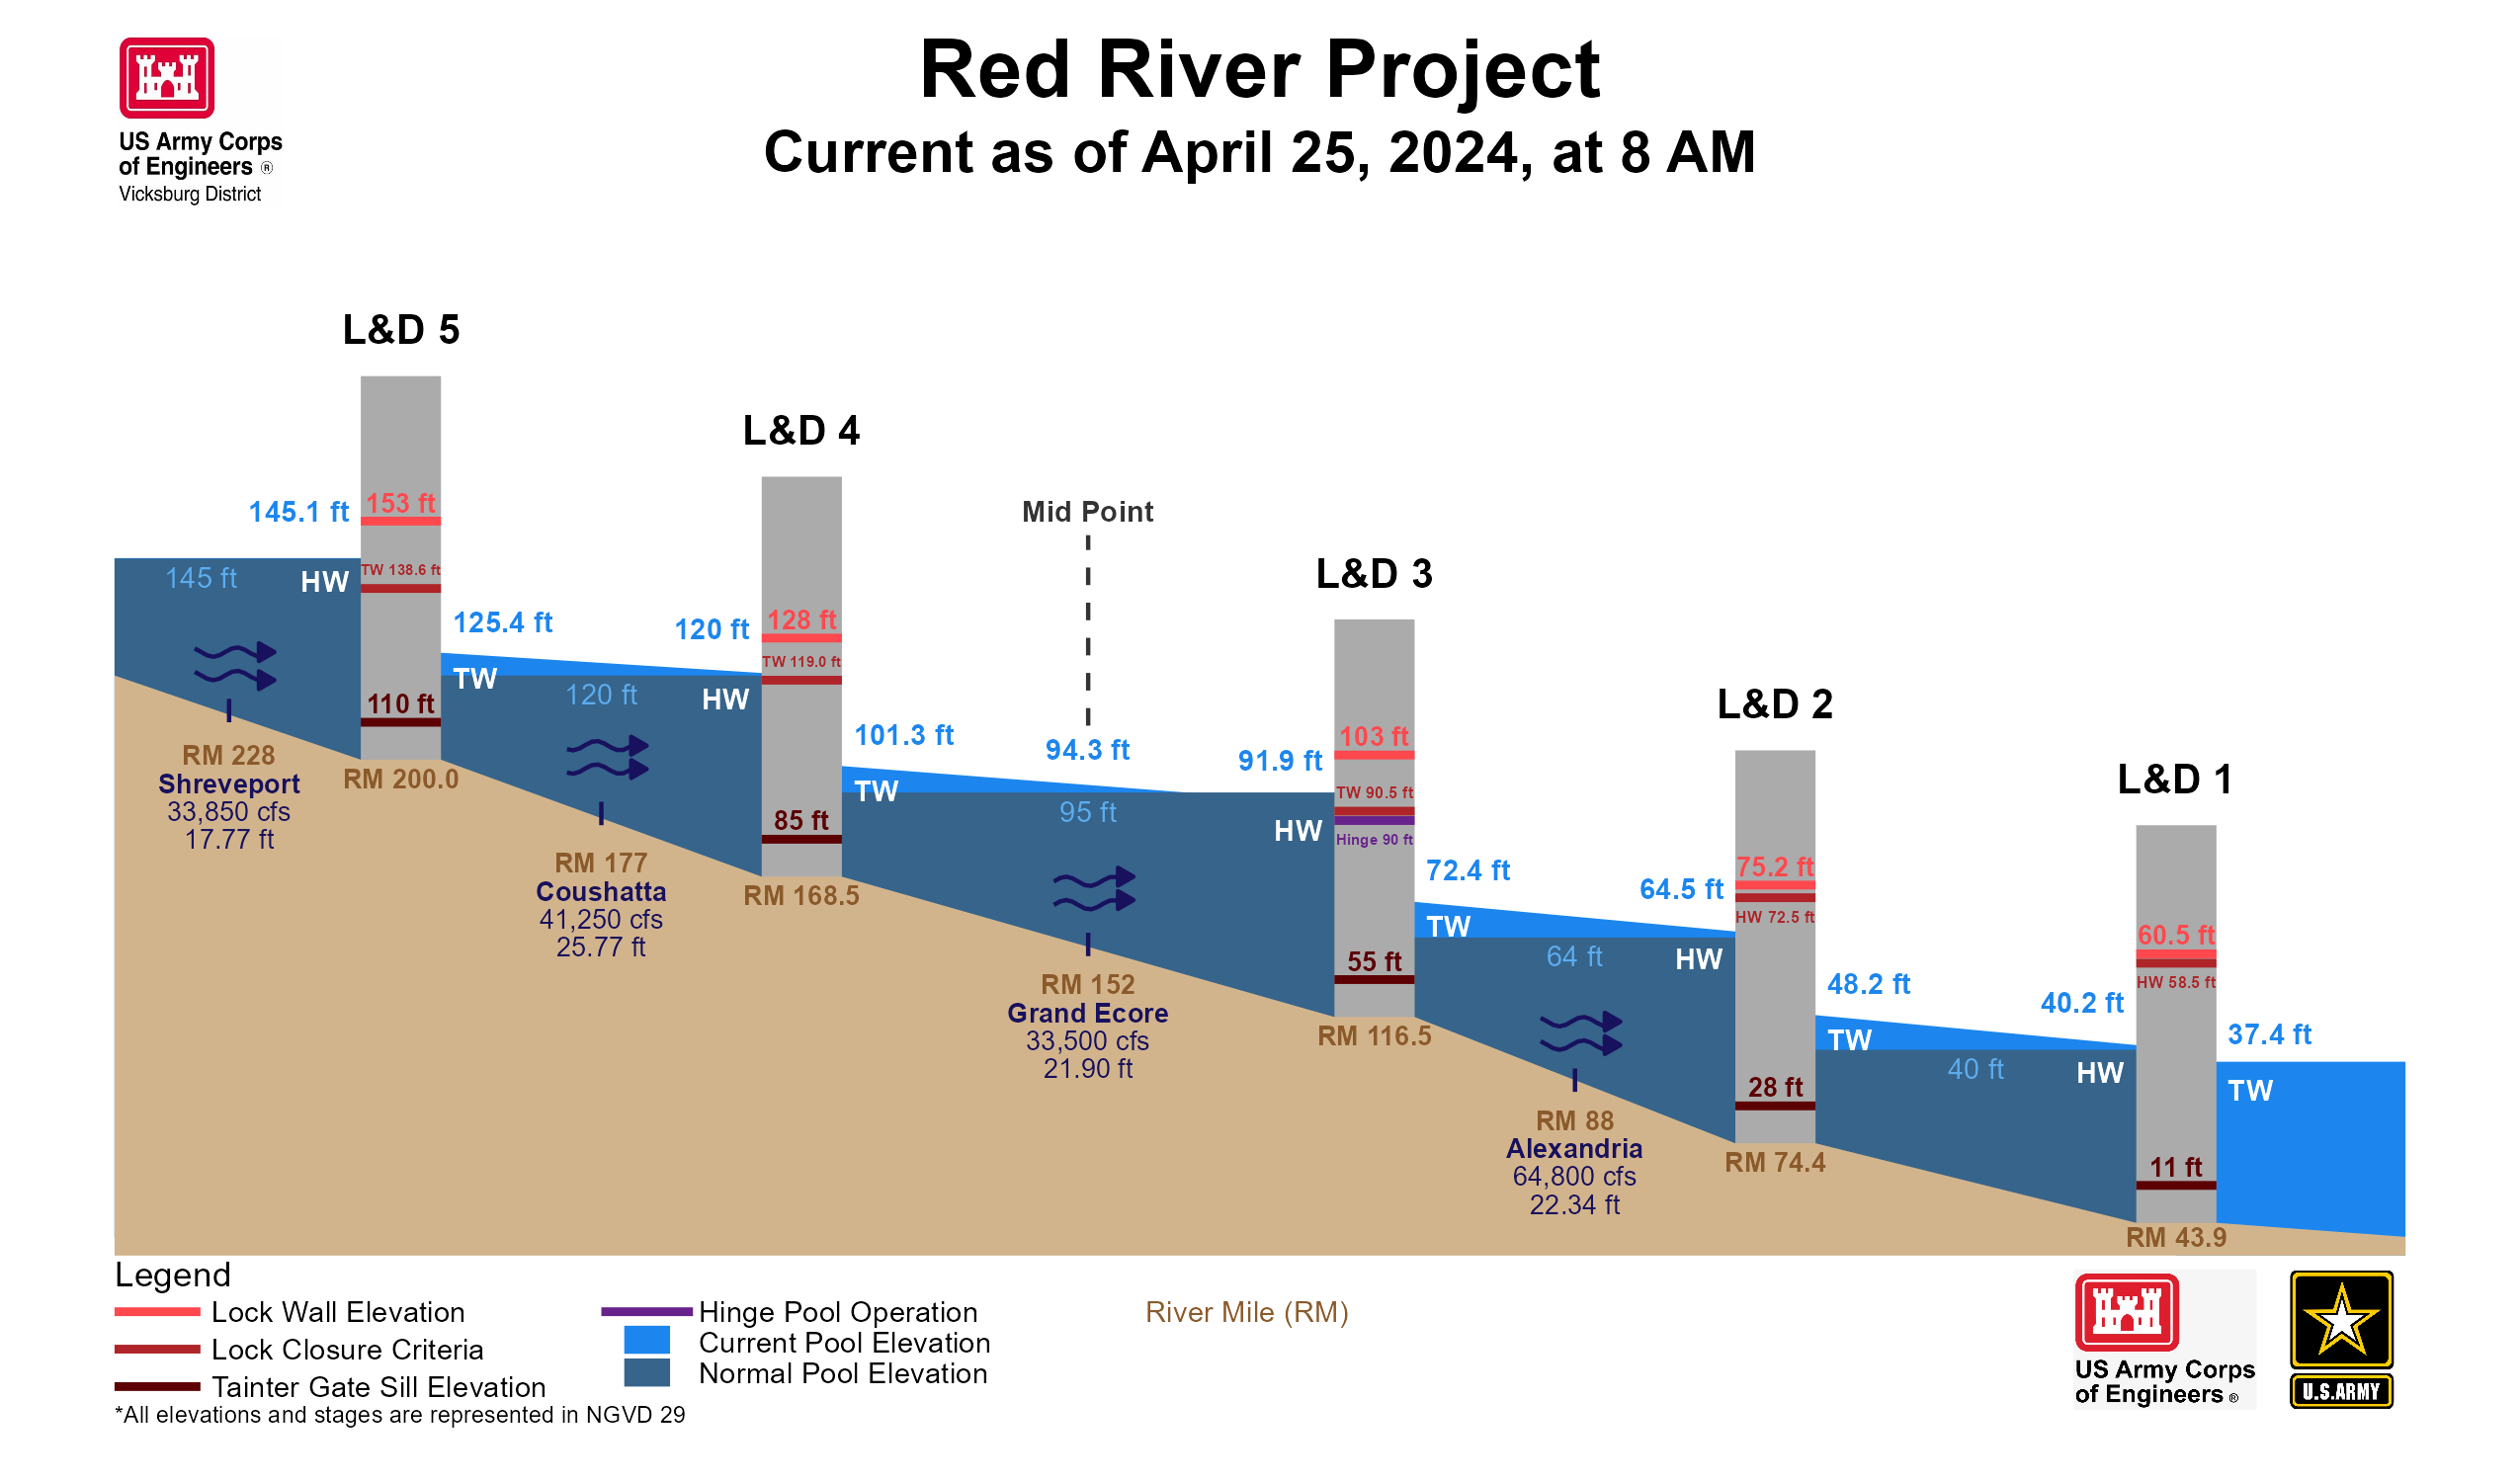
On a single graphic, available on computers and mobile devices alike, anyone with navigation interests on the Red River can access river stage data, current pool elevation and normal pool levels, flow rates, river miles, and headwater and tailwater data for each of the system’s five locks and dams. The graphic draws on data already publicly available, but repackages it into an easy-to-read product.
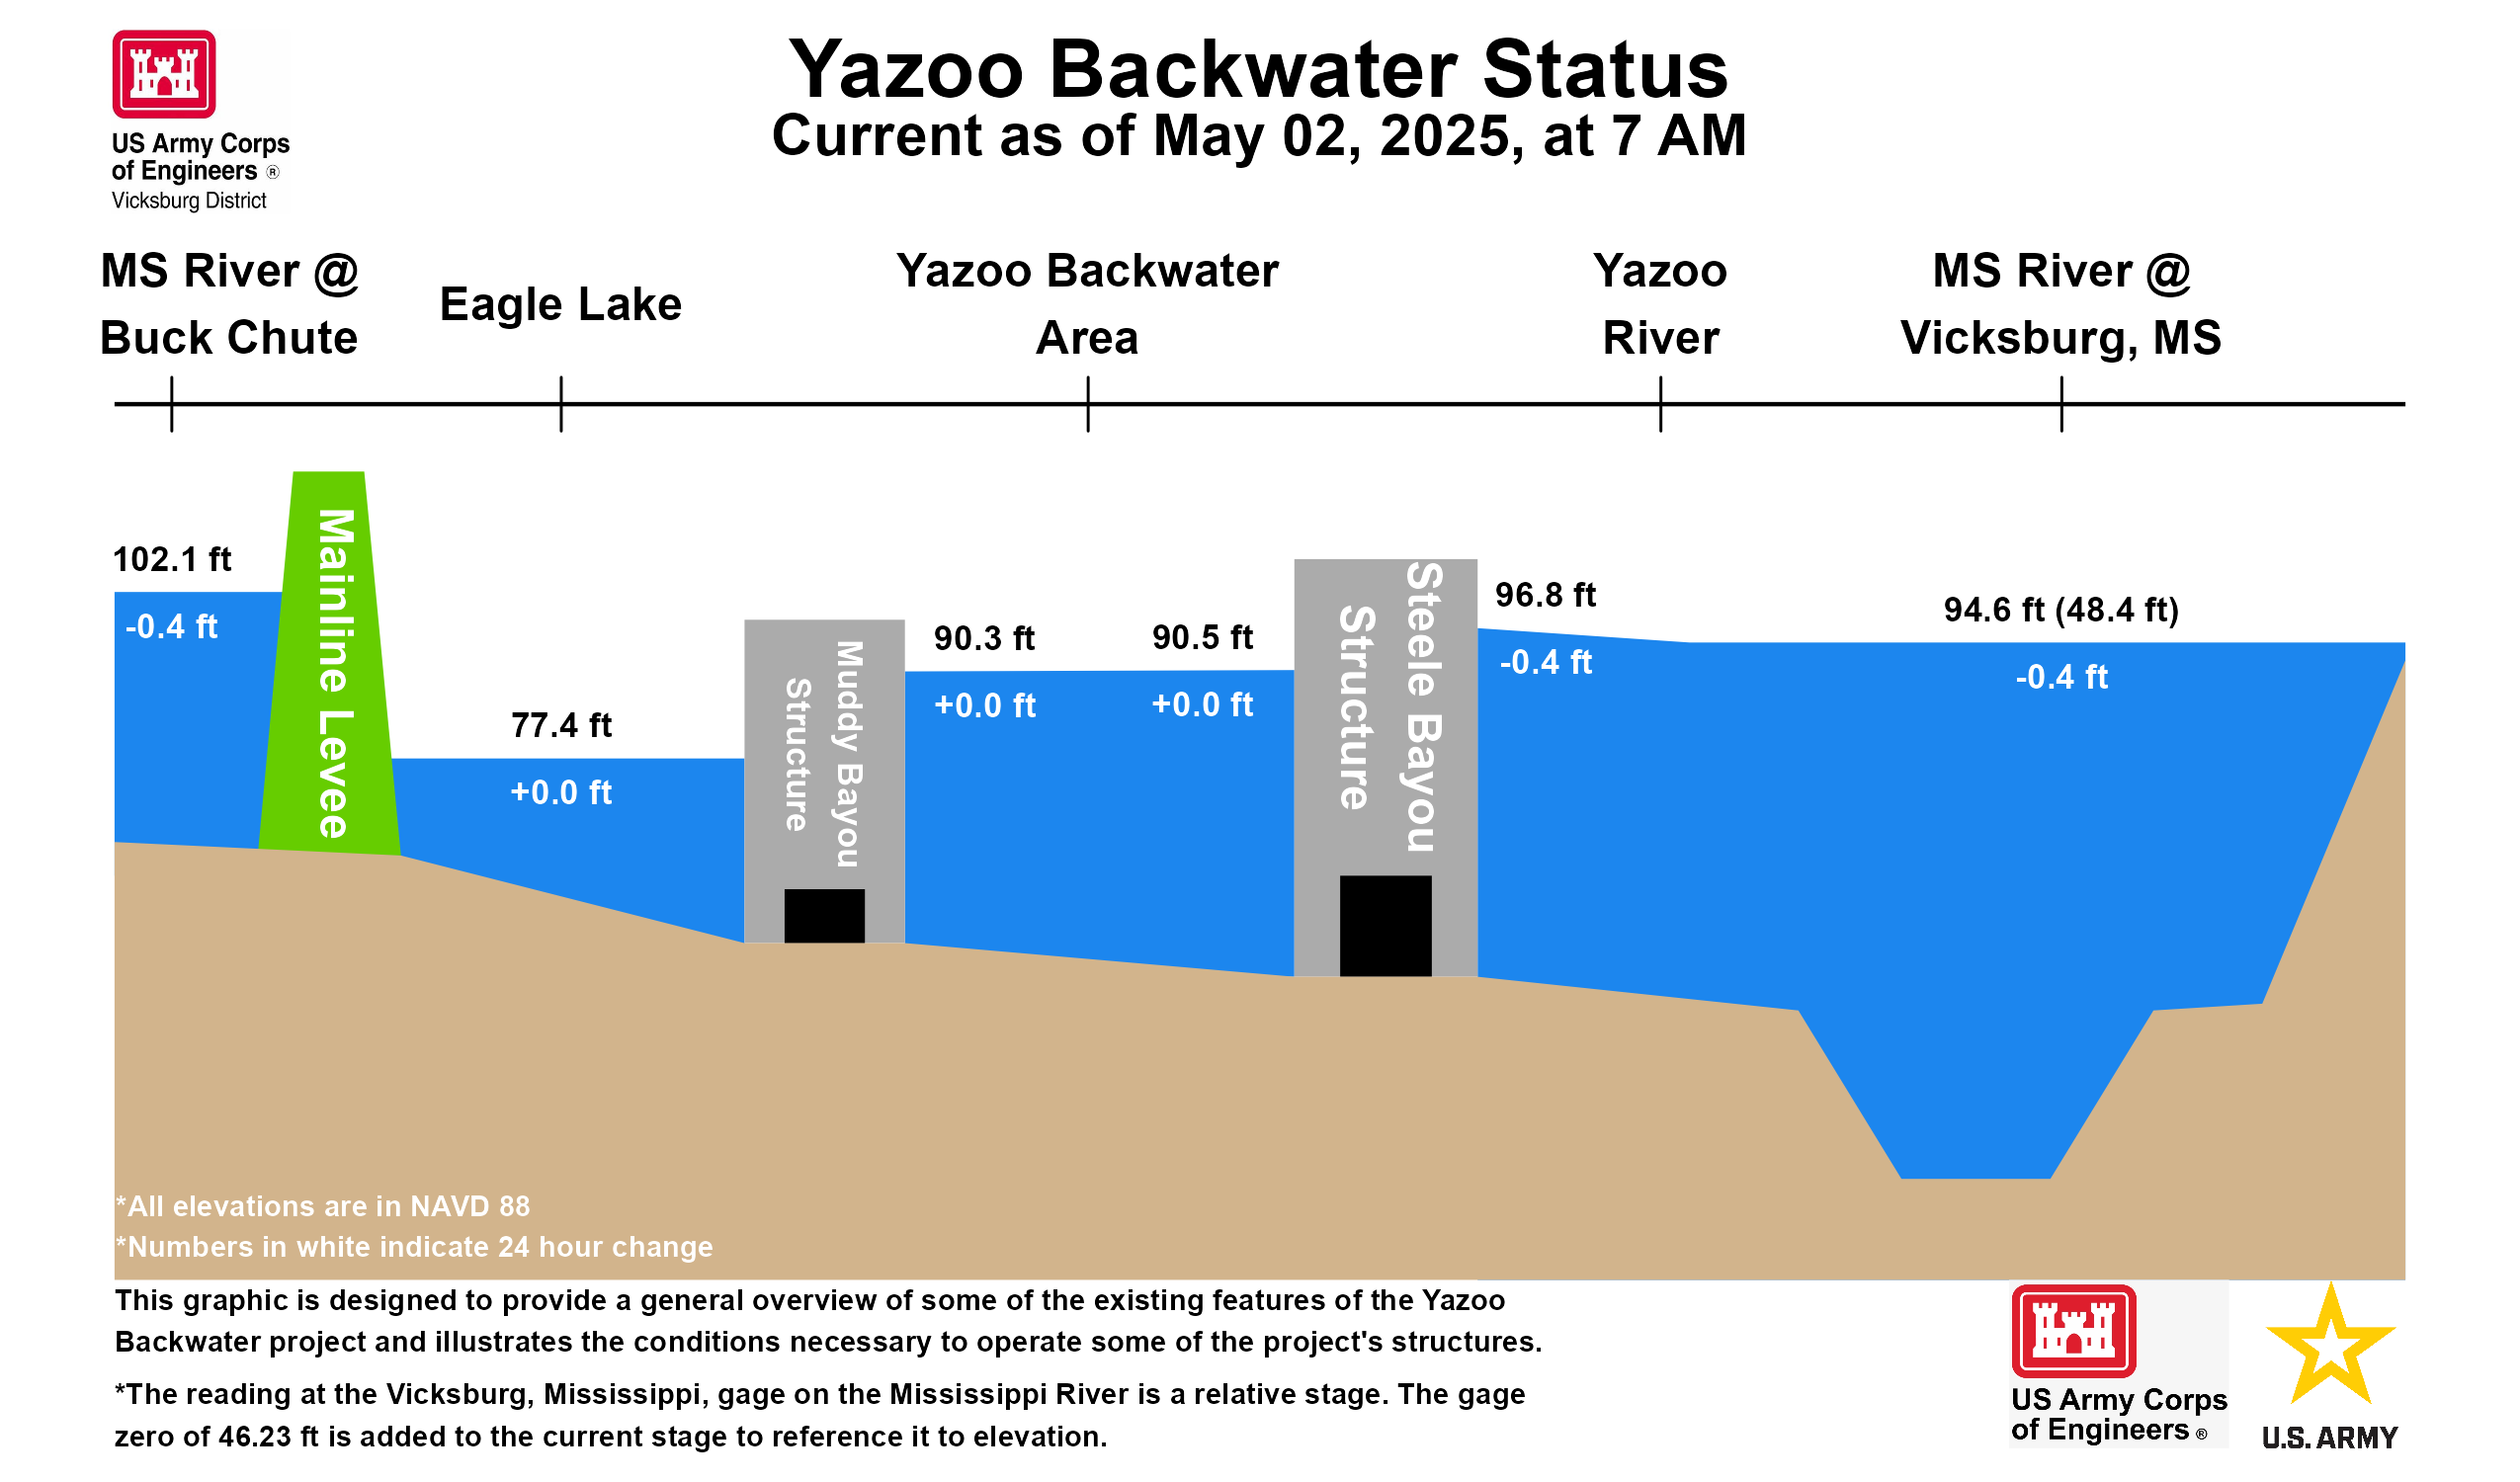
Drew Smith, chief of the Water Control Office, which oversees the district’s water resource management operations, including flood-control dams, navigation structures and pump stations, said the graphic—and the technology behind it—grew out of floods facing the district the past few years. The 2019 flood on the Mississippi River, in particular, impacted the Yazoo Backwater Project near Vicksburg, Miss. The project prevents back flooding from the Mississippi River up the Yazoo during high water events.
“We were constantly having to brief that, and there were a lot of numbers being thrown around,” Smith said. “Why aren’t the gates open? Why are the gates closed? Being able to show this graphically … made a lot more sense to people.”
Some members of Smith’s team had gone to a workshop sponsored by another Corps district to learn a programming language called “R.” The R coding language is designed with statistics and data in mind, making it possible to “scrape” data points and display them in a dynamic way. The platform proved perfect for producing a new hydrographic tool for the Corps.
“When you have several different structures involved and a bunch of different water levels involved, it’s easier to see that on a graphical representation,” Smith said.
Initially, the tool was used internally, particularly with the Corps’ upper management and senior officers.
“They loved it, so we just expanded on that [and asked], ‘How can we use these?’” Smith said.
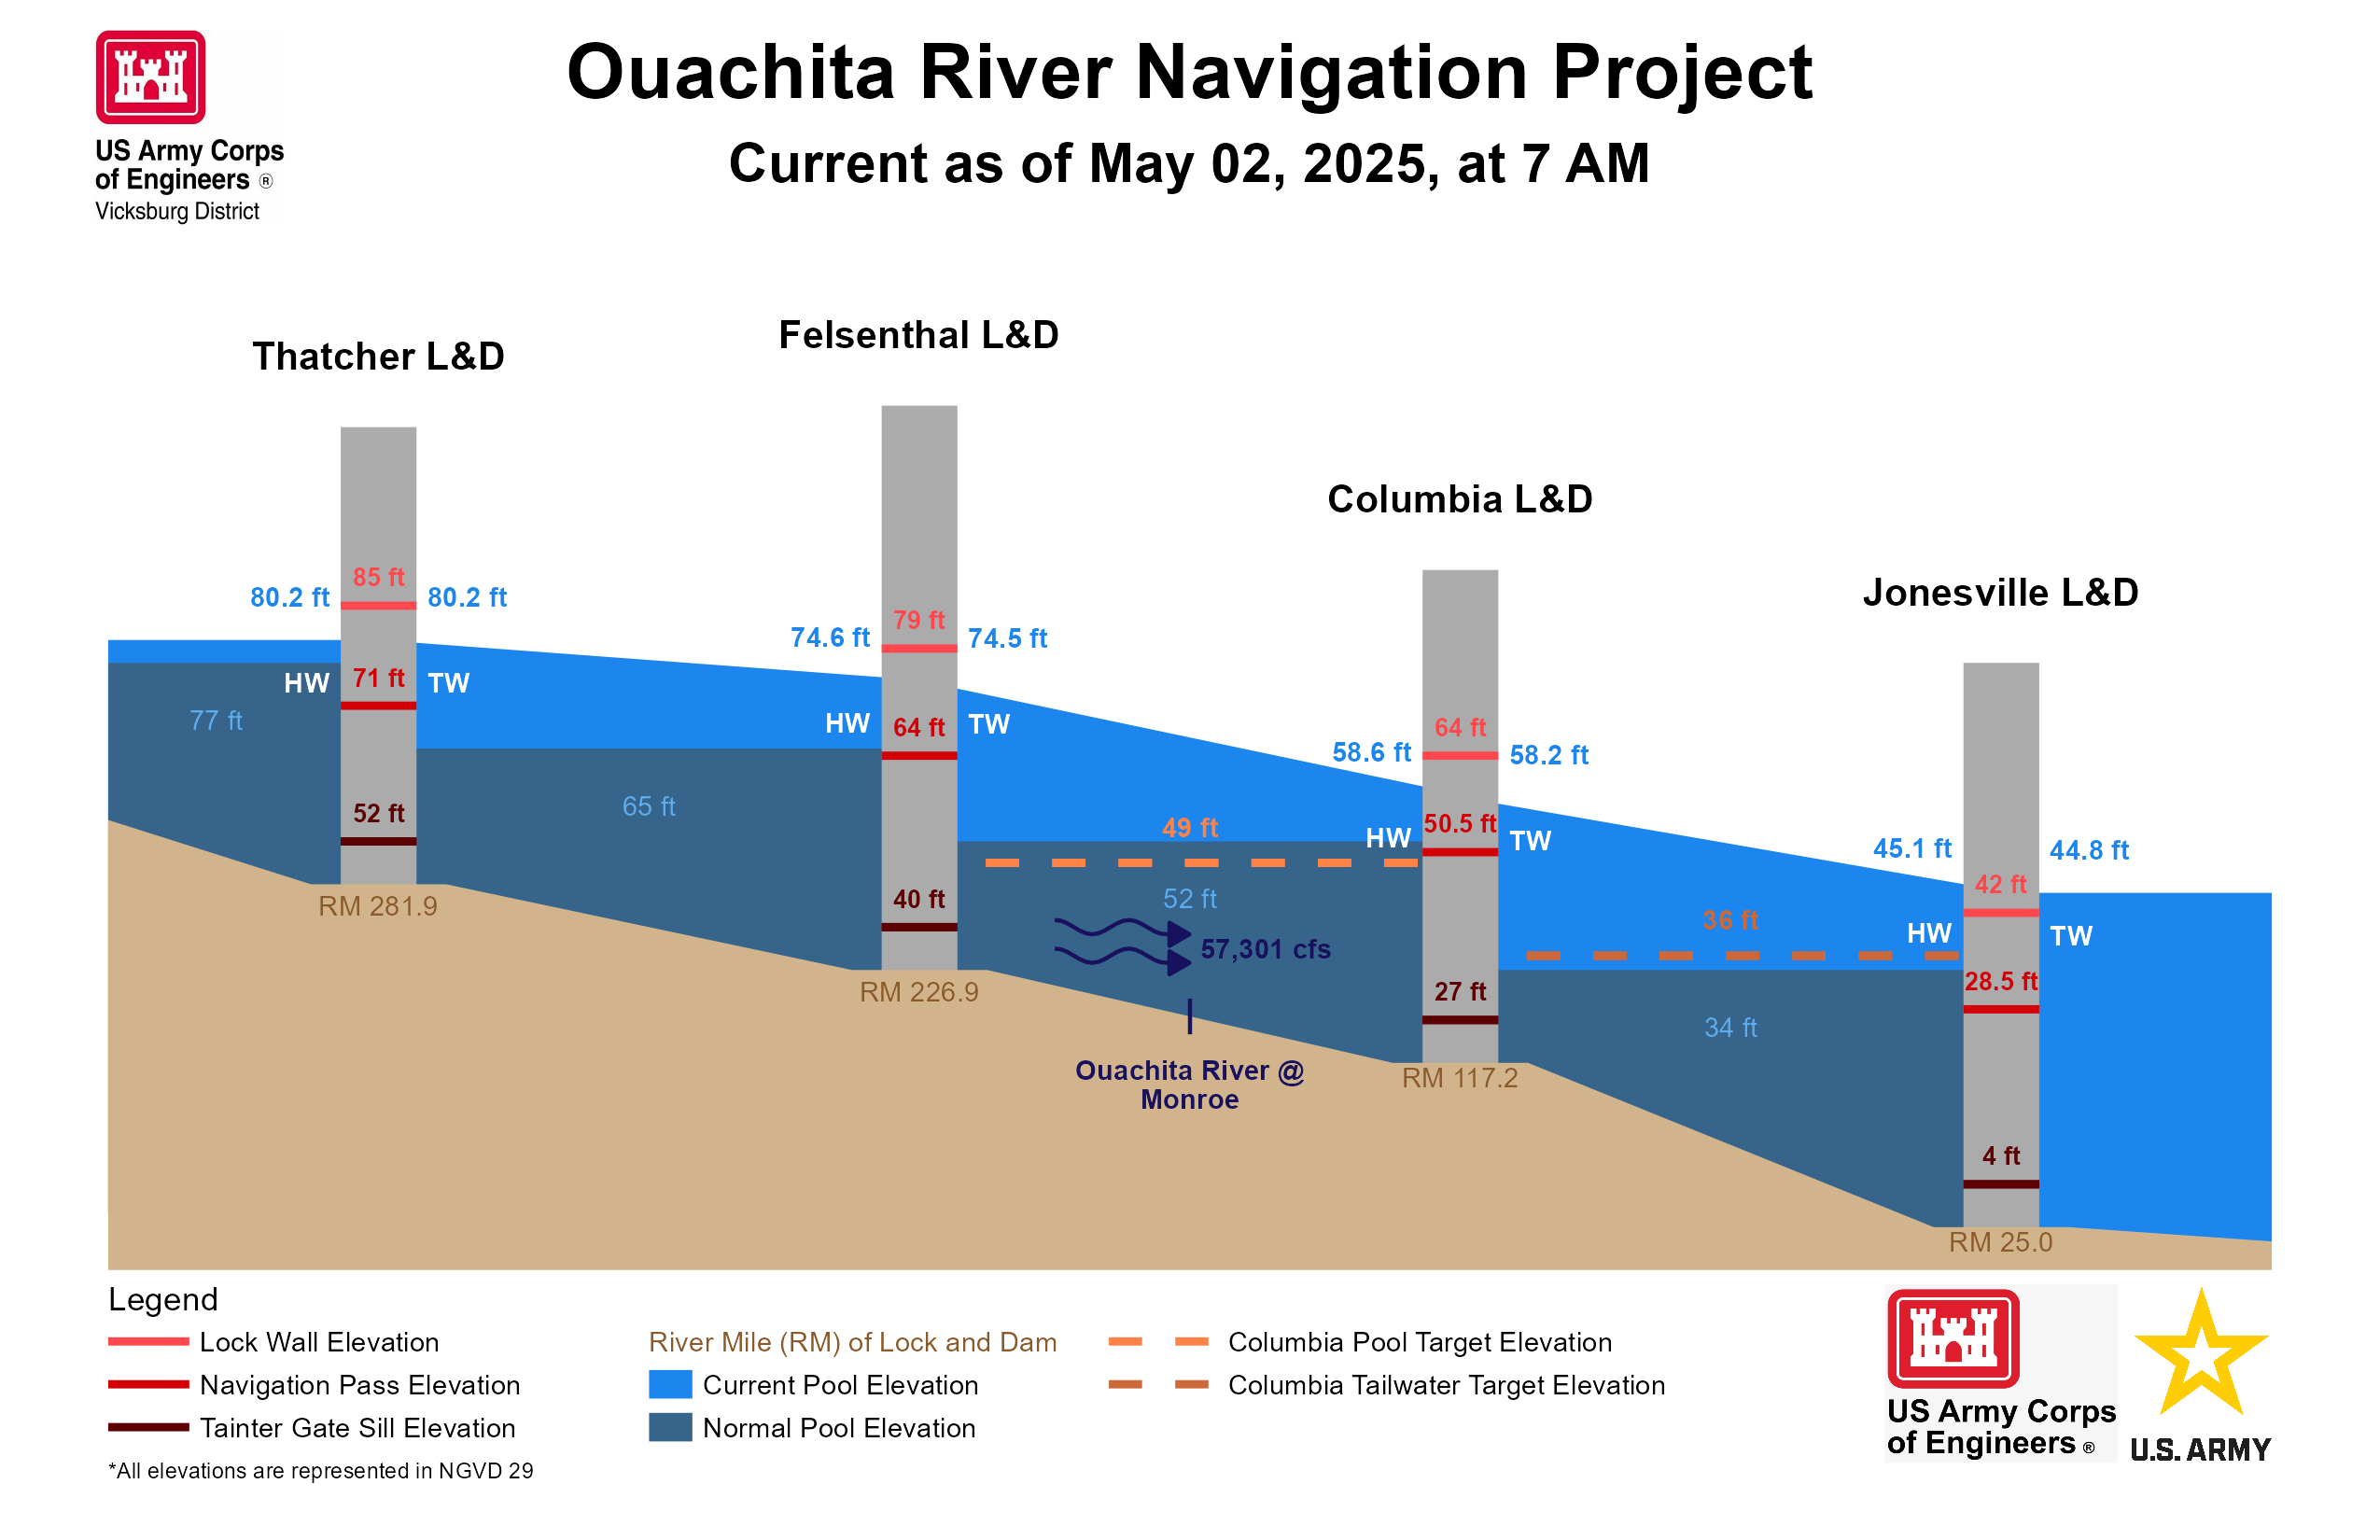
Since then, the Water Control Office has produced a graphic for the Ouachita River, along with the one for the Red River. So far, Smith said the graphic has been well-received by people who work along the Red River.
“It was a hit with them, and we got some feedback,” Smith said. “It’s a fluid graphic. If folks in the industry need things added that would be helpful, that’s totally doable. That’s why we have it on a public-facing server.”
Smith said he hopes the graphic will especially be helpful with trip planning and logistics on the Red River, which is a very dynamic waterway.
“A towboat pilot could be sitting in Old River Lock down around Simmesport (La.) waiting to come up the river to Shreveport, and he can pull up that graphic and know the river conditions all the way to Shreveport through every lock before he ever leaves Old River Lock,” Smith said.
Rich Brontoli, executive director of the Red River Valley Association, said he expects member companies to use the graphic just that way.
“The new Red River Lock & Dam graphic, provided by the Vicksburg District, is a welcomed addition to our waterway ‘tool box,’” he said. “Different river stages require adjustment to tow operations. Currently we need to go to numerous sites for stage information on different stretches for the waterway, while this graphic provides important data for the entire system on one site.”
Smith said he’s already been sharing the design and technology behind the graphic with other Corps districts and with federal partners, like the U.S. Geological Survey and the National Weather Service. He hopes the graphic first developed by Vicksburg’s Water Control Office will find useful applications elsewhere.
He also hopes people will share the link widely. Since the graphic resides on a simple HTML site, with data updated hourly, it’s an easy way to have timely data for the waterway.
“It’s easy to put on social media,” he said. “If we get into a situation on the Red River where we have a big flood and navigation is closed, that’s an easy graphical thing people can see on social media.”
The Red River graphic is available at https://www.mvk-wc.usace.army.mil/plots/red_structures.png. Likewise, the Ouachita River graphic is available at https://www.mvk-wc.usace.army.mil/plots/ouachita_structures.png. The original graphic for the Yazoo Backwater area is https://www.mvk-wc.usace.army.mil/plots/Yazoo_Backwater_Structures.png.

