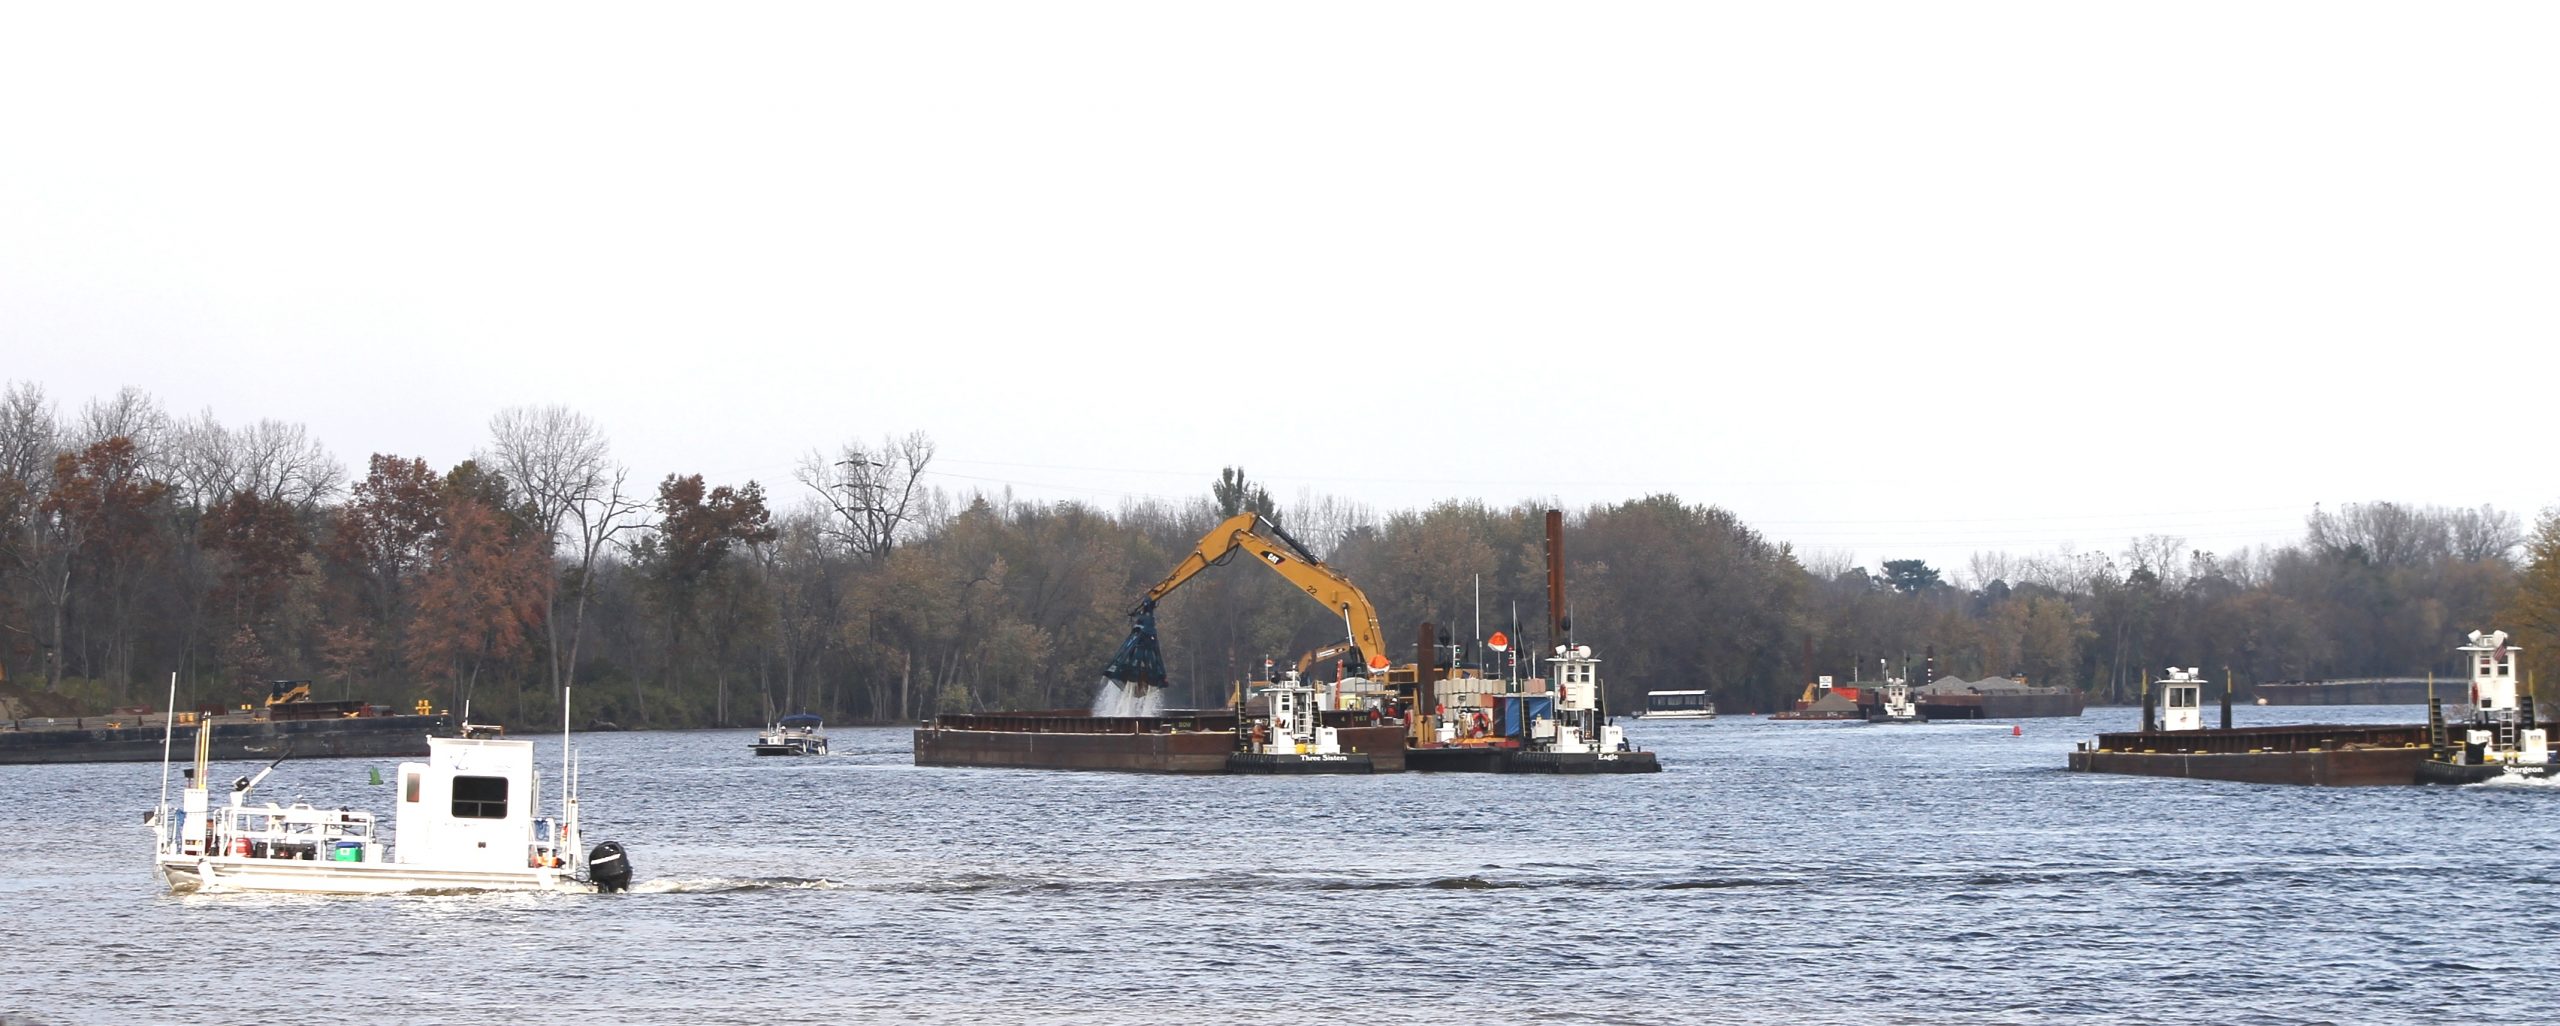
On April 11, EPA released its second five-year review report for the Hudson River PCBs Superfund Site. The report looked to determine if the remedy was successful, as outlined by the 2002 Record of Decision (ROD). For now, EPA will defer its final determination about the protectiveness of the remedy until it can review more years of fish tissue data.
EPA completed its first five-year review in 2012, while dredging was still ongoing. EPA released a draft of the second report in June 2017 for public comment. The latest April report is the culmination of additional research, including an in-depth review of more sediment samples. In January 2018, the New York State Department of Environmental Conservation (NYSDEC) provided a number of samples collected during 2017, and EPA spent the next year reviewing and compiling the new data.
In a separate action, along with the latest review report, EPA issued a Certification of Completion of the Remedial Action for General Electric (GE). This is the second of three certificates needed to complete GE’s part in the project. The first certification came for phase one of the project in 2012. This second certifies that the work, as it was originally defined by the ROD, has been completed, and does not release GE from liability. EPA Director of the Office of Regional Counsel, Eric Schaaf said of the third and final certification for completion of the remedial action, “that’s not even on the table for decades.”
Over three decades ending in the 1970s, GE discharged an estimated 1.3 million pounds of PCBs into the Hudson River from two factory sites in Fort Edward and Hudson Falls, about 40 miles south of Albany. In 1984, EPA added about 200 miles of the Hudson River to the Superfund list, covering the entire stretch from Hudson Falls to the southern tip of Manhattan in New York City.
In 2002, after much study and debate, EPA chose a plan to dredge a 40-mile stretch of the Upper Hudson River between Fort Edward and Troy. The dredging plan was detailed in the Record of Decision (ROD). The project addressed the most highly contaminated areas in the Upper Hudson River. After dredging, the river would need time for natural attenuation, which, over time, will continue to reduce PCB levels throughout the river. The full process will take at least five decades.
In 2006, a federal judge finalized the agreement between GE and EPA, requiring GE to carry out the work under the 2002 ROD. GE performed dredging between 2009 and 2015. It dredged a total of 2.75 million cubic yards of contaminated sediment from the 40-mile stretch of the Upper Hudson River.
Data Analysis and Long-Term Trends
It will take time to show that the remedy has been fully effective through fish, water quality and sediment data. Post-dredging data does show PCBs continue to decline in the water and sediment.
EPA Deputy Regional Administrator Walter Mugdan said fish data has been collected since the 1970s. “We have a long and robust data sheet,” he said. EPA collects those samples twice a year, in the spring and fall at various locations and EPA may expand the number of sample collection locations in the future.
Sediment sampling has also been a large part of the ongoing monitoring process, and the first sediment samples date back to the 1990s. EPA Policy Advisor for the Hudson River Gary Klawinski said water quality data is the easiest to collect, fish and sediment data collection are more complex. EPA has seen some encouraging water and sediment data, Klawinski said. “For fish, we statistically need about eight years of data to establish a trend,” he said.
For sediment analysis, the project had some early data sets to consider. After 2016, a standardized format for sample collection was established to facilitate data comparison and trend analysis, but data prior to 2016 had been done in different ways for different purposes. NYSDEC adopted this same methodology in 2017 for its samples, making comparing data and integrating sets together much easier.
In 2016, GE collected/analyzed 215 sediment samples. In 2017, NYSDEC analyzed 1,162 samples.
Sediment sampling will continue every five years. The next five-year review will include at least six years of post-dredging sediment data. “We need to space the sampling events because we want the concentrations in the sediment to change, so you can measure the change,” Klawinski said.
River Sections vs. River Reaches
EPA Regional Administrator Pete Lopez said the robust review process and the collaboration with NYSDEC “signify that our goal was to be rigorous and exhaustive with state partners and others.”
The review process also allowed EPA to evaluate its methodology to better understand the river’s recovery. In its public comments to the June 2017 draft report, NYSDEC encouraged EPA to consider data in different river reaches.
The ROD divided the 40-mile stretch of the river from Fort Edward to Troy into three sections. “That’s been a controversy since we made that decision,” Mugdan said.
River Section 1 is about 6 miles and includes one reach. River Section 2 is about 5 miles and includes two reaches. River Section 3 is about 29 miles and includes five reaches. Looking at data from individual river reaches will provide a more detailed look at the health of the river, and the growing data set has made this easier. “This allows us to have a common vocabulary between the two agencies and gives us the ability to be more attentive to the performance of the remedy,” Lopez said.
Contamination Hot Spots and Tri-Plus PCB Concentration
The sediment analysis so far has not discovered any contaminated hot spots. “We did identify three geographic areas of interest,” Mugdan said. The data shows slightly elevated levels of PCBs. Those areas will receive additional focus moving forward, but no action is required at this time.
In River Section 2, further upstream, EPA identified one area of interest around an island, where erosion had exposed sediment to the water that was previously inland. The other two areas of interest lie in River Section 3, further downstream, very close to each other. The levels of PCB in fish are generally reflective of the average of PCBs in the sediment, Mugdan explained. The three areas are very small, compared to the larger project, and are unlikely to affect fish data.
Collective analysis of the data show that more than 99 percent of the sampled locations are below the surface sediment criteria set in the ROD, in both dredged and non-dredged areas.
The primary purpose of the Hudson River project is to reduce PCB levels in fish, in order to protect humans and other species that consume fish. The ROD set a remediation goal of 0.05 mg/kg of PCBs in the fish (a level that would allow people to eat fish from the river once a week) – a process that will take decades to reach.
Data analysis also looked at both total PCB concentration and Tri-Plus PCB concentration, which is an important subset of total PCBs known to bioaccumulate in fish. Bioaccumulation is the driving force for the remedy and the measurement of health. “The fish become symbolic of the river’s recovery,” Lopez said.
Although the river’s full recovery needs more time, the EPA report said dredging was very effective in removing the contaminated sediment.
“The Hudson River is pretty dynamic and fairly fast flowing,” Klawinski said. Other areas are separated by reaches, locks and dams, where the river is more calm. “’We get some high flows and it’s dynamic enough to move sediment around,” he said.
Overtime, as the river runs and shifts, it could uncover contaminated sediment or move contaminated sediment into a clean area. EPA will continue to monitor the project for many, many years to come. So far, no recontamination of the dredged areas in the Upper Hudson River has taken place, and recovery of the sediment, water and fish has made significant strides, as it is predicted to do in the future.


