NWS Marks Anniversary Of 1997 Flood
The National Weather Service’s Ohio River Forecast Center has partnered with local forecasting offices to memorialize Ohio River Basin flooding in 1997 through a website in connection with the flood’s 25th anniversary.
In March 1997, the Ohio River rose to the highest level since March 1964, with navigation on the river stopped completely from Cincinnati, Ohio, to Smithland, Ky., due to locks being flooded, according to the National Weather Service (NWS).
Twenty-four people died in the flood in Kentucky, Ohio, West Virginia and Indiana, according to the NWS website, titled A Look Back: Remembering the Flood of March 1997.
“The flood occurred without the benefit of any melting snow, and with normal soil moisture conditions before the event began,” the website said. “Run-off was maximized since vegetation had not yet begun to green up. Most of the region received more than 6 inches of rainfall. The heaviest rainfall amounts occurred along and just south of the Ohio River, where 10-12 inches fell.”
New Rainfall Records Set
The rain began falling the evening of February 28 and continued, in some areas, through March 2. Thunderstorms repeatedly rained over the same places. A new record for the largest 24-hour rainfall recorded anywhere in Kentucky was set when 10.48 inches of rain fell at the NWS office in southern Louisville, eclipsing the 10.40-inch record set in Muhlenberg County on June 27-28, 1960.
Some rain gauges were destroyed by flood waters. While records were destroyed, NWS officials believe some locations in Kentucky and southern Ohio received more than 12 inches of rain in less than 36 hours. Severe weather accompanied more than 250 reports of flash flooding through all four states. Between February 28 and March 2, 10 tornadoes were reported in Kentucky along with 42 reports in the region of severe thunderstorms with damaging winds and/or large hail.
In the Louisville metropolitan area, about $200 million in damage was attributed to the flooding, with 50,000 dwellings affected. Interstates 64 and 65 were closed. Near Cincinnati, the Ohio River rose more than 20 feet in just over 24 hours, resulting in hundreds of evacuations along the river from New Richmond, Ohio, to Aurora, Ind.
“The deluge resulted in record flooding along smaller streams and some of the worst flooding along the Ohio River since at least 1964, and in some places since the Great Flood of 1937,” the website notes. “Several tributaries of the Ohio River set all-time record river crests that still stand today.”
Preparing For The Flood
One of the meteorologists who helped prepare for the flood was Jim Noel, now the service coordination hydrologist at the NWS Ohio River Forecast Center in Wilmington, Ohio.
“About three days ahead of time we recognized there was going to be a significant storm system,” he said.
Although the system matched into the composite historical flood risk, he said at the time there were no supercomputer models, and forecasting wasn’t as precise.
“It doesn’t give you the details that you need,” he said of the forecast information available at the time. “It’s just somewhere in the Ohio Valley, we may get a flood.”
By the morning of February 28, he said it became apparent to him and other forecasters that the newest technologies they had on hand were pointing at Kentucky as the biggest flood risk, while older technologies continued to insist there would be more rain north of the Ohio River.
In the late afternoon and early evening, the storm system developed over northeast Arkansas, with temperatures still in the 60s and 70s in the Ohio Valley. As it moved into and across Kentucky, a band of the state saw 6 to 15 inches of rain, with the heaviest rainfall in the Licking River Basin south-southeast of Cincinnati.
“When you start getting more than 2 or 3 inches of rain at a time, that’s all runoff, and it just goes into the rivers,” Noel said. “In 12 hours from February 28 to March 1, it went from no rain in Kentucky to water rescues and over 8 inches of rain had already fallen, and the storm was still to the west and coming in.”
The peak flood period for the Ohio Valley is January through April, but the peak month is March, Noel said.
“It doesn’t take weeks of rain like people sometimes think,” he said.
The risk for flooding increases with no greening of trees and grasses, so that all the water runs off once the ground is saturated.
Additionally, he said, some people were unprepared for that kind of flooding because they hadn’t seen the water get so high in that area for years, perhaps not even in their lifetimes.
“For the middle Ohio River—Louisville up through Cincinnati—that flood was the biggest flood since 1964, and it still stands since the biggest since 1964,” Noel said. “Going into that, we had had a very quiet period overall from 1964 to 1997, so for the average person, it had been pretty tranquil for 30 years. That’s not a generation, but it’s quite a long time.”
Lessons Learned
Noel is quick to give credit to multiple agencies working together quickly with the National Weather Service to prevent the 1997 flood from becoming an even bigger disaster.
One of those was the U.S. Army Corps of Engineers, which used its dams as flood-control structures.
Although the river crested at 64.7 feet in Cincinnati, without the Corps holding back water at the dams, it would have been closer to 72 feet, Noel said.
“And that translates down, then, from Evansville all the way to Paducah.”
One major weather forecasting improvement that came out of the flood was the installation of more real-time rain gauges by the U.S. Geological Survey, Noel said.
“We’ve gotten a lot more real-time gauging information so we know what is going on better,” he said.
Additionally, the NWS has now changed how it accounts for rainfall in its forecasts. Back then, Noel said, meteorologists only included 24 hours of future rainfall in their forecasting. Now, they can project up to 72 hours out.
River forecasting has improved especially, he said. In 1997, the NWS predicted the river height for one time daily, at 7 a.m.
“You had all this information in between,” Noel said. “You didn’t know what the river was doing.”
Now the forecasts are for every six hours.
River forecasts also went only about three days into the future, he said. Now they extend five to 10 days in the future.
“The lead times have gotten better,” he said. “It’s not perfect, but it gets us in the ballpark. We’ve made a lot of advances.”
Still, he said, forecasting rainfall amounts remains much more difficult than forecasting temperature, and river forecasting is the hardest of all because forecasters must not only get rainfall predictions for one area correct but also for all the places upstream.
“It may not even rain in Paducah and you get a big flood on the Ohio River because of all of the rain that fell in Ohio and West Virginia,” Noel said.
Wet Spring Ahead
Part of the reason the NWS created the website on the 25th anniversary of the 1997 flood is to draw people’s attention to flooding risks during what is historically an active time for floods.
Noel said the public tends to be much more aware of tornado warnings and severe thunderstorm warnings in the spring than they are of flood warnings, but wanted to remind them that paying attention is important, even when it isn’t raining around them.
“What happens upstream is significant,” he said.
Eighty-three percent of the deaths in the 1997 flood were from either walking in floodwaters or driving into floodwaters, the NWS said. Because of that, Noel also stressed the NWS saying of “Turn around. Don’t drown,” which reminds people it is better to detour away from a flooded roadway than to risk crossing it, even though that could cause commuters a delay in their travel.
That reminder could be a timely one, he said, as the La Niña pattern, where waters in the equatorial Pacific are cooler than normal, often creates a wetter weather pattern in the Ohio Valley.
Looking ahead, Noel said, the NWS expects a wet March and April, although it should dry out some in May.
“We are at risk of flooding, at least over the next 60 days, and then things will quiet down in Kentucky and on the Ohio River,” he said. “We don’t know the exact magnitude, but certainly minor to moderate flooding can be expected across the region over the next 60 days with isolated major flooding not being able to be ruled out.”
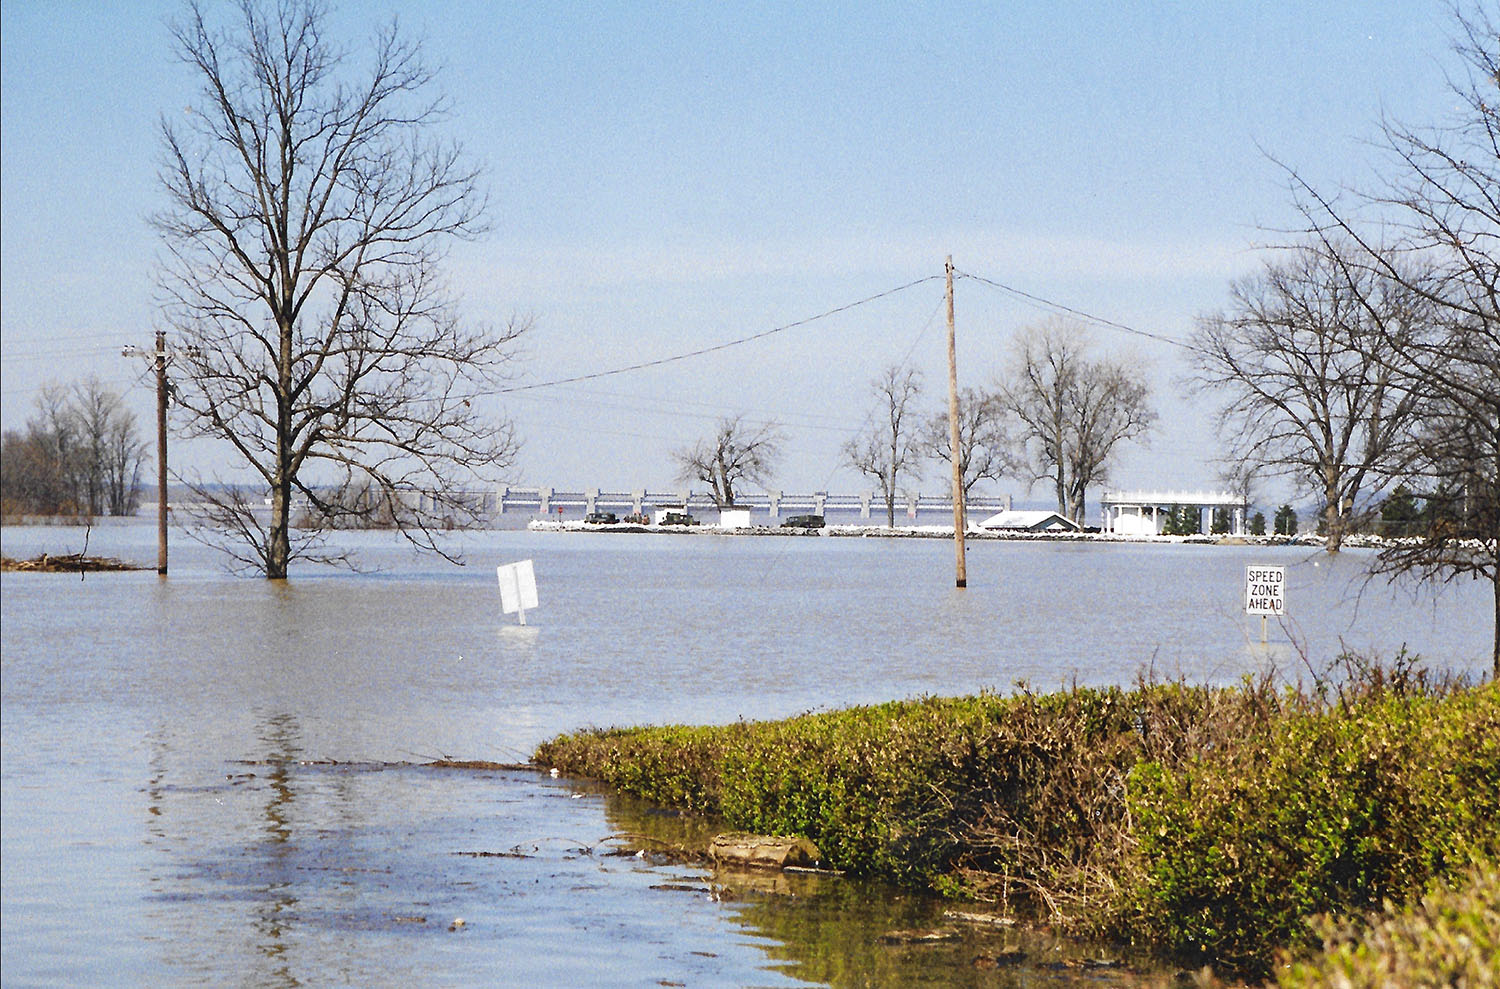
Caption for top photo: The flood of 1997 was the largest flood since 1964 in the Ohio River Valley. The National Weather Service has created a website with photos, video interviews and facts to memorialize the flood, in which 24 people died. The Ohio River was closed for roughly 400 miles, from Cincinnati, Ohio, to Smithland, Ky., because of flooded navigational locks. This photo shows downtown Louisville, Ky. (Photo by Judy Webber, courtesy of the National Weather Service)