

Surging Grain, Soybean Exports Buoy Covered Barge Market
At this year’s Inland Marine Expo in Nashville, hosted by The Waterways Journal, an attendee asked about surplus barges in the covered fleet. With barge demand in 2022 and 2023 weakened by poor U.S. grain and soybean exports—equivalent to more than 1,000 excess barges—the market faced a shortfall of about 15 million short tons of cargo. Grain and soybean exports were pressured by smaller U.S. crops and increased competition from Brazil and the Black Sea, while barge owners are keeping barges afloat longer.
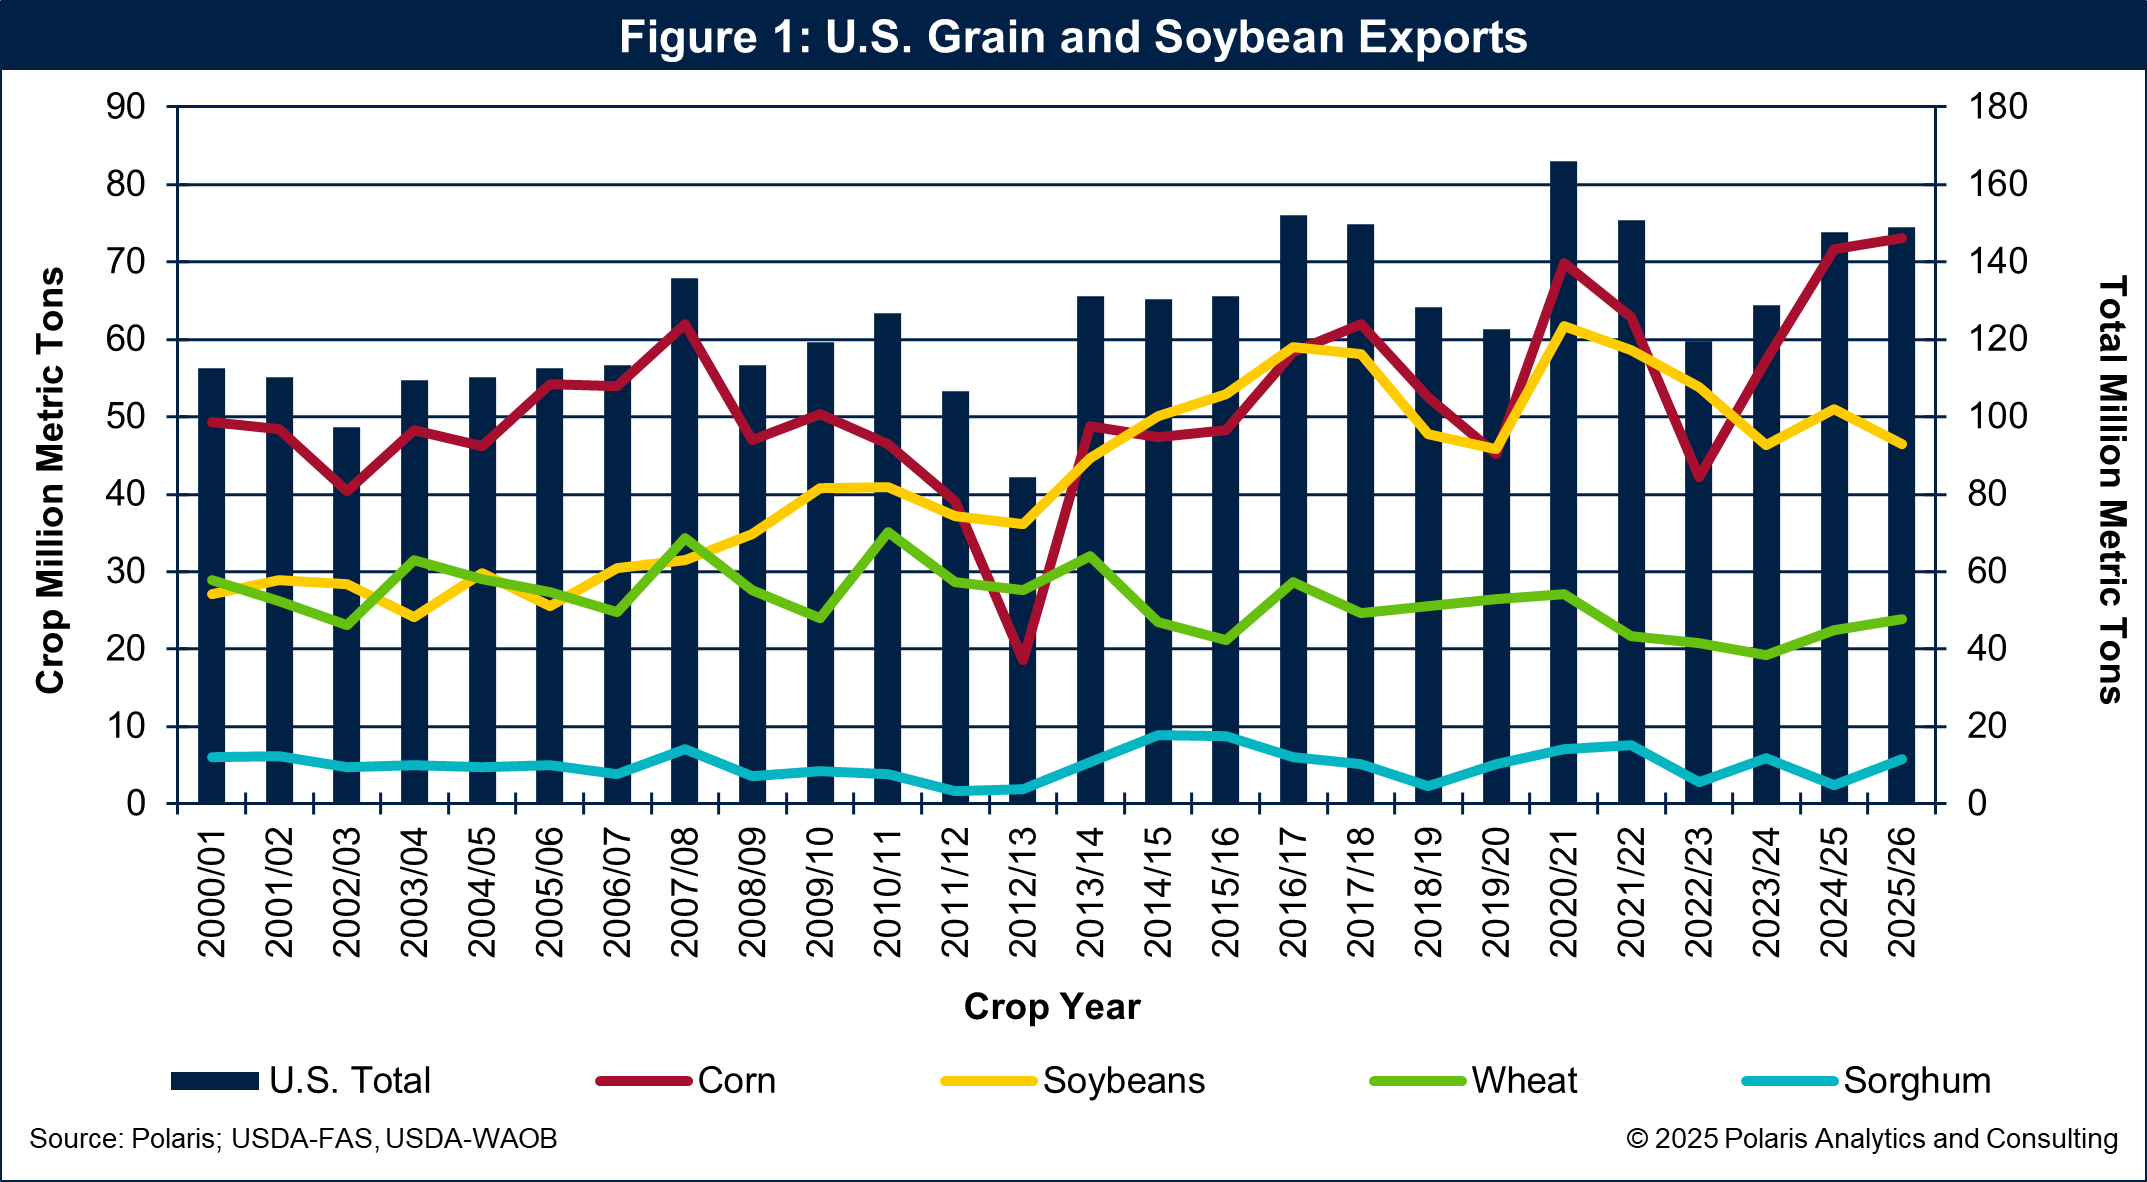
U.S. Grain Exports Recovery Underway
In its August crop report, the U.S. Department of Agriculture’s National Agricultural Statistics Service posted a large boost to corn production for the 2025-2026 crop, with harvested area increasing by 1.9 million acres to 88.7 million and raising corn yield by a whopping 7.8 bushels per acre to 188.8 bushels. Taken together, harvested area times yield, corn production is forecast to be record large, exceeding 16.7 billion bushels for the first time in U.S. history.
However, despite a large corn crop potential, there is still time before harvest begins and what the final yield will be. The crop can be greatly impacted by changes in weather between now and harvest. Regardless, and suffice it to say, such a large production potential in August gives the export channels much enthusiasm.
This record-breaking corn crop fuels optimism for export channels, driving significant increases in forecasted export volumes. With such a robust production outlook, USDA’s World Agricultural Outlook Board increased new crop (2025-2026) corn exports by 200 million bushels to a record 2,875 million in its August World Agriculture Supply and Demand Estimates report. Exports of wheat and sorghum are improving, while soybean exports have been in a downward trend since peaking in 2020-2021. With a large corn crop and improving exports, there are large volumes to be moved to export positions in the coming marketing year.
Taking grains and soybeans together, USDA is forecasting U.S. exports to total 147.6 million metric tons for the 2024-2025 marketing year that ends August 31, nearly 19 million or 15 percent higher than 2023-2024 and about 28 million, or 23 percent, more than the recent bottom in 2022-2023. For the marketing year starting September 1, exports are forecast to total 149 million metric tons during 2025-2026, an increase of 1 percent as shown in Figure 1. Total U.S. exports in 2025-2026 will pull back as soybean volumes weaken, offsetting gains in other crops.
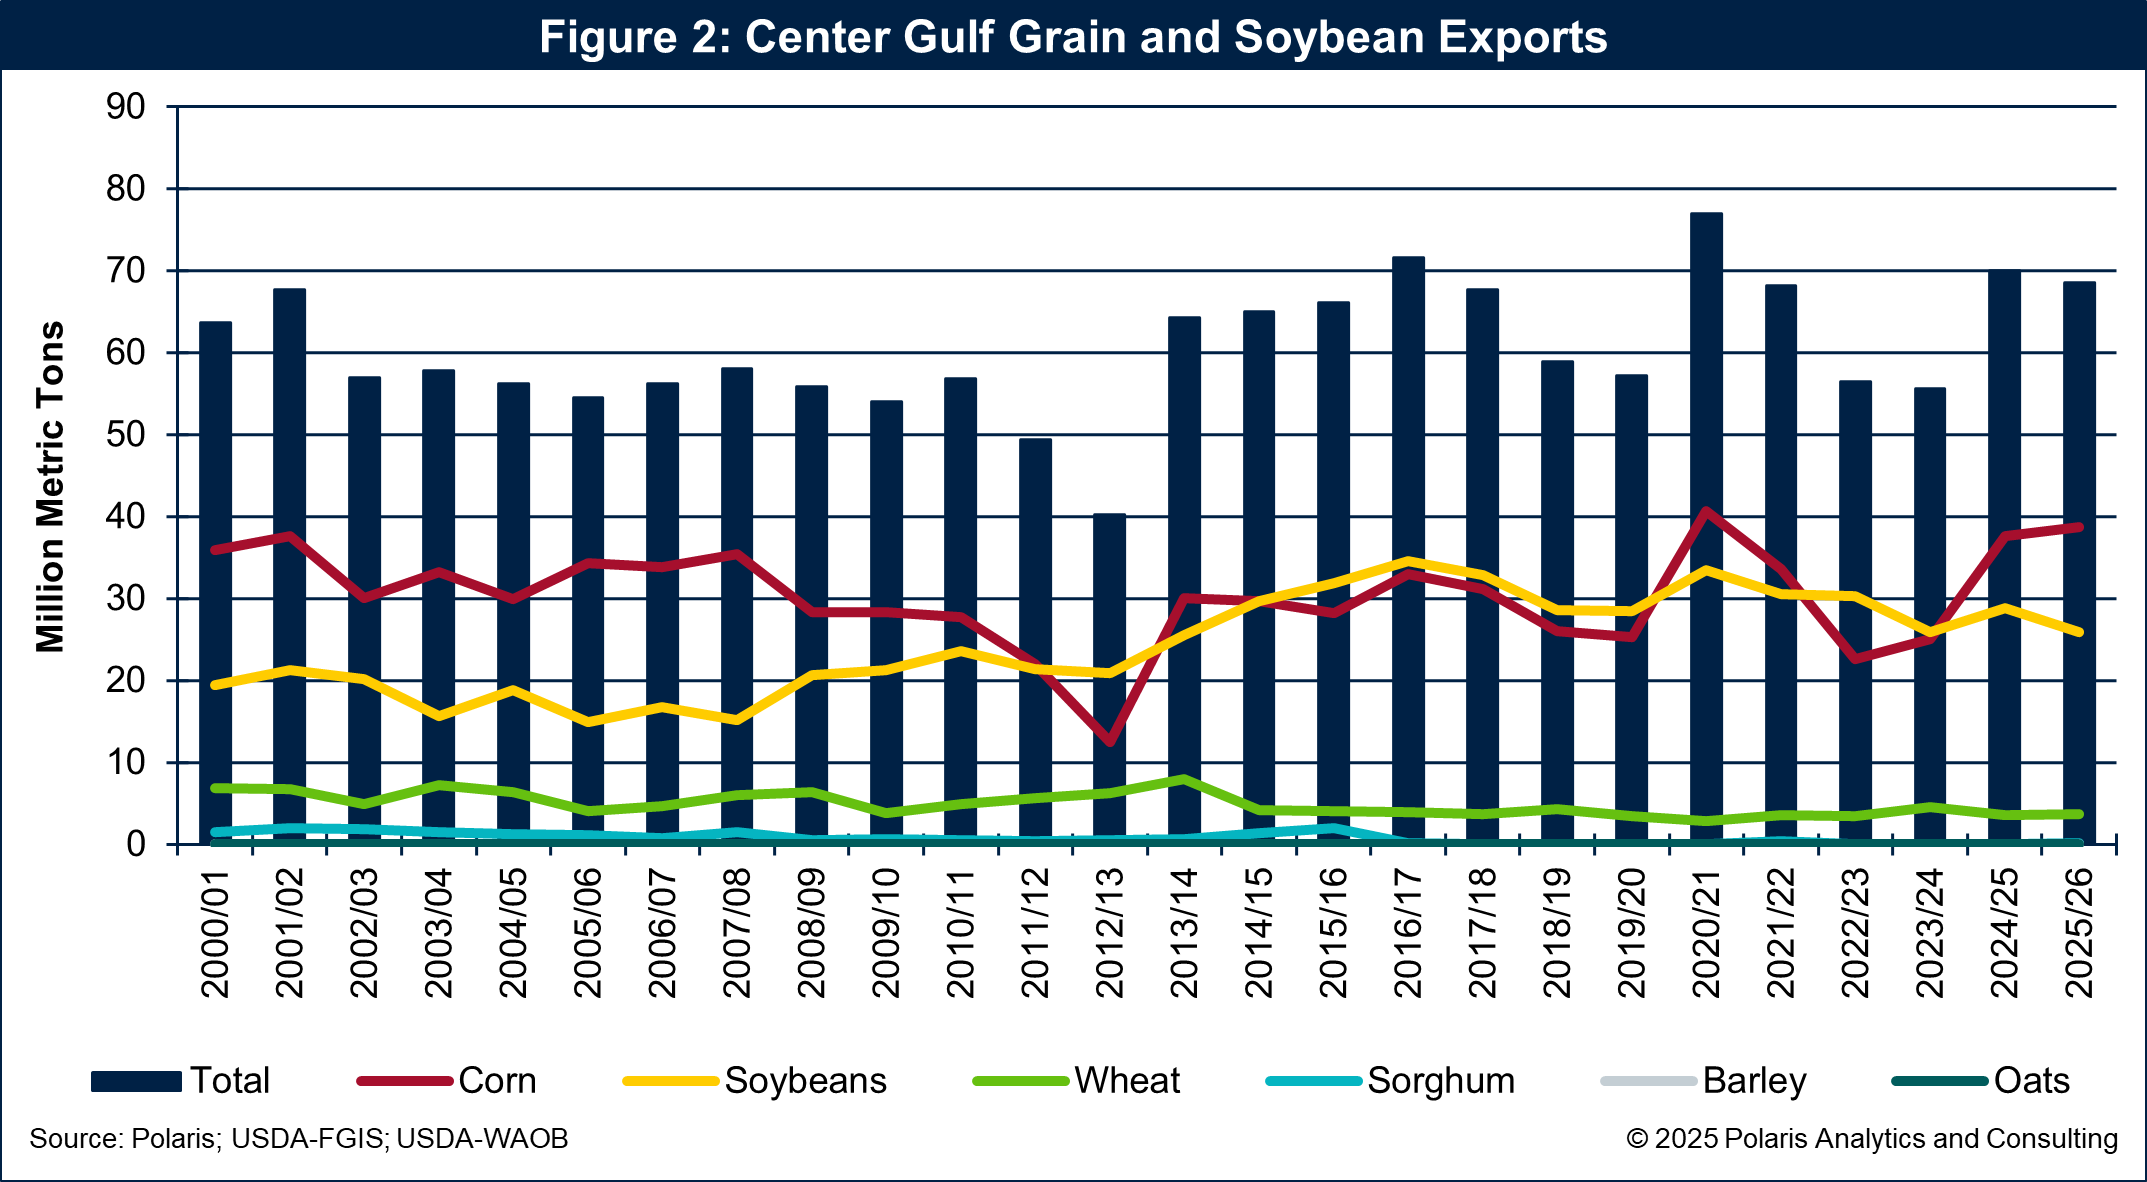
Center Gulf Grain Exports Recovering
U.S. grain and soybean exports are improving at all port ranges since bottoming out in 2022-2023 as shown in Figure 2. The Center Gulf port range is expected to see exports through grain elevators located along the Mississippi River Ship Channel increase 14.4 million metric tons from a recent low of 55.7 million during 2023-2024 to 70.1 million for 2024-2025. For the year ahead, exports through the Center Gulf are expected to be down marginally to 68.5 million metric tons.
Exports of corn through the Center Gulf will lead the way higher in 2025-2026. Offsetting the rebound in corn is a drop in soybean exports during 2025-2026 through the Center Gulf.
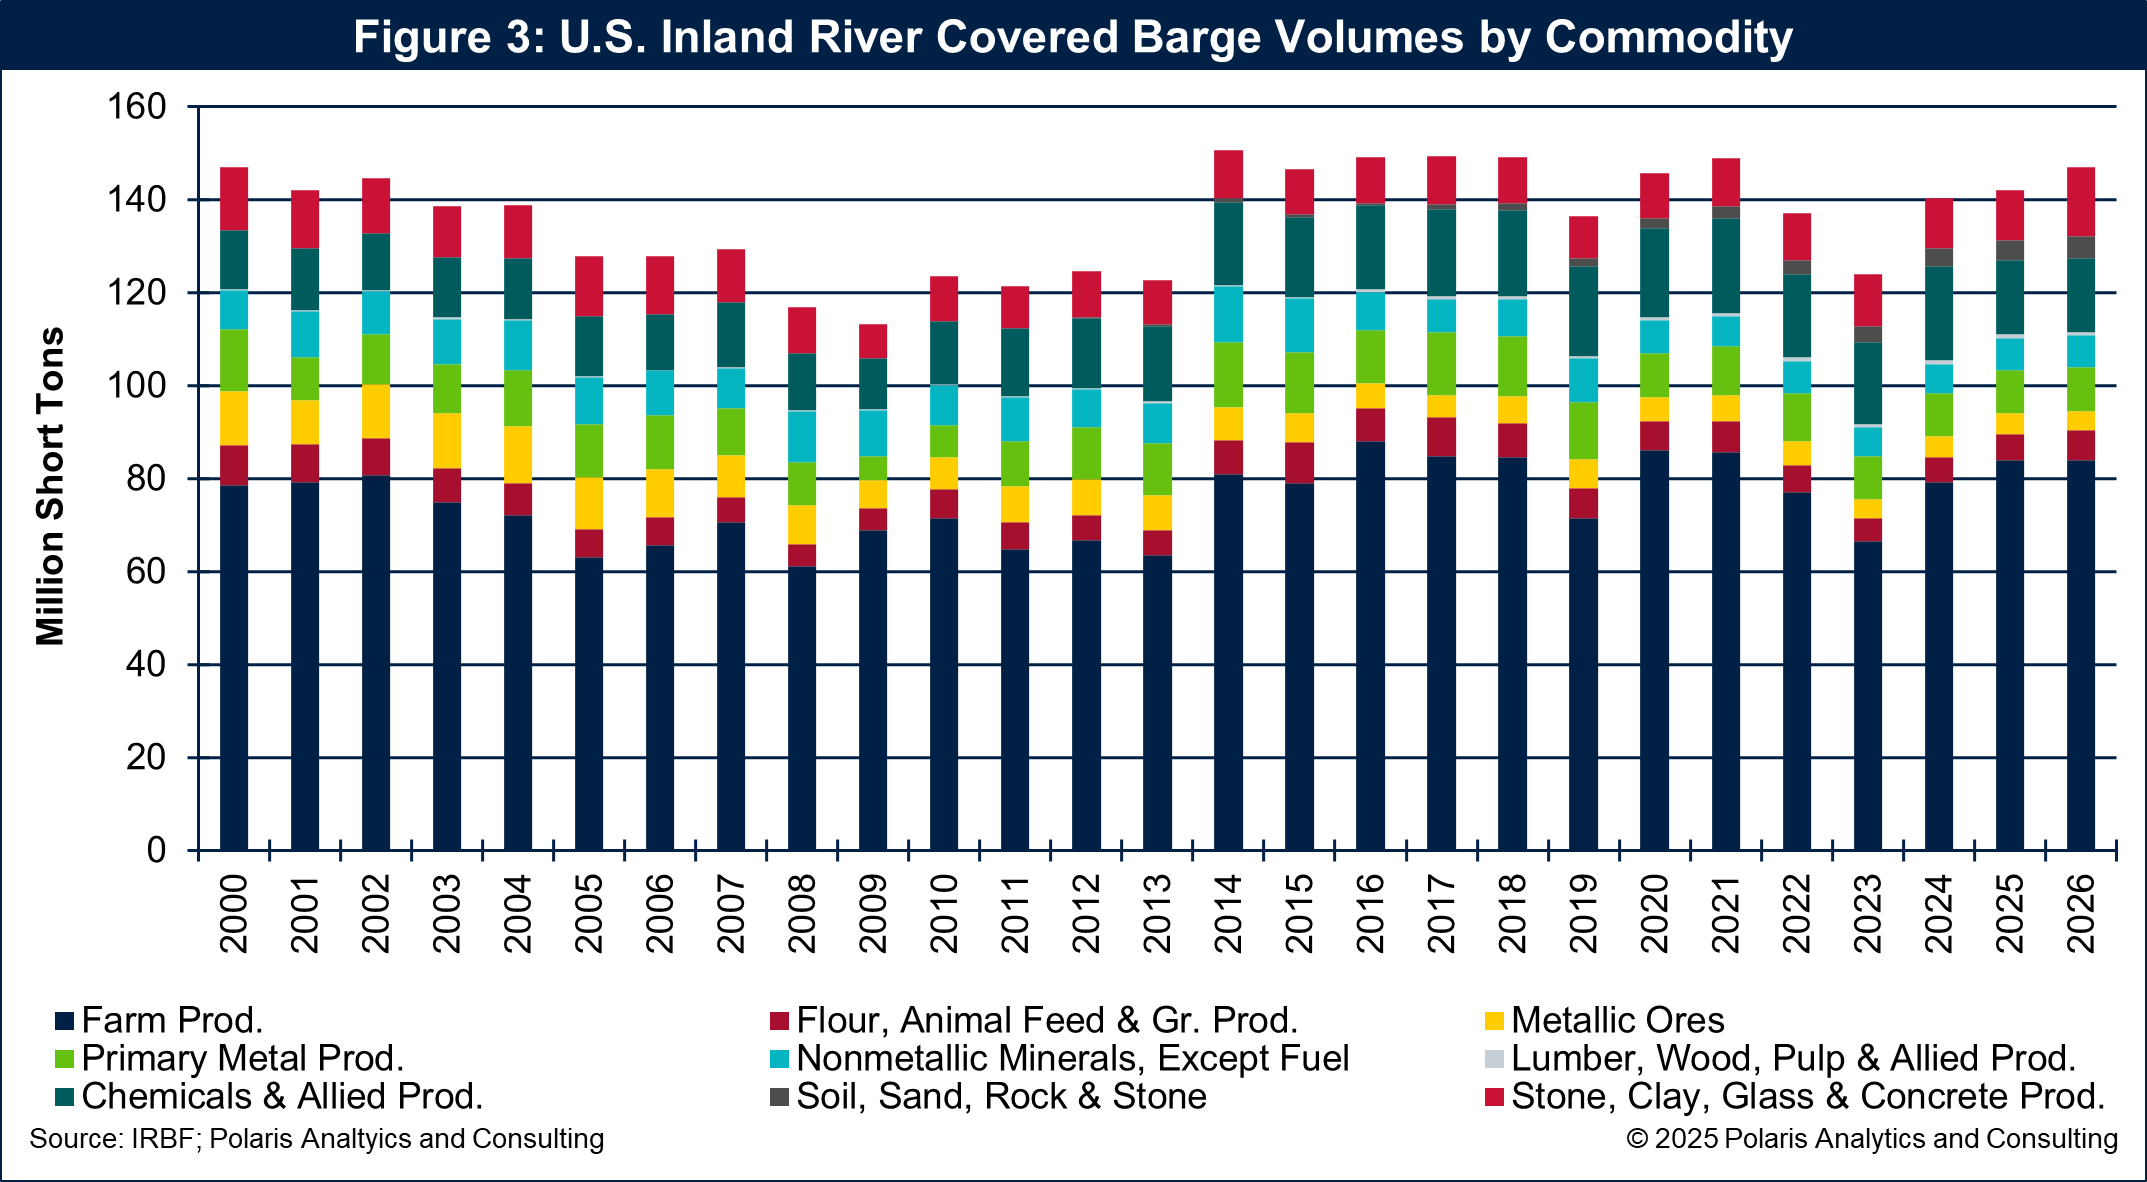
Covered Barge Market Recovery Underway
Rising grain exports are revitalizing the covered barge market. Covered barge volumes rise and fall on changes in grain exports, and the past four years have been testament to that. During 2023-2024, for example, the grain export program was the lowest since the drought-induced 2012-2013 marketing year. The drop in 2023-2024 grain and soybean exports led to a corresponding drop of 14 million short tons of commodities moved by covered barges to 125.5 million during calendar year 2023.
For calendar year 2024, covered barge volumes are estimated to have rebounded 16.1 million short tons to 141.6 million. During 2025, barge volumes are forecast to increase 1.7 million short tons to 143.3 million. Looking at 2026, covered barge volumes are expected to improve further by 4.9 million short tons to 148.2 million. There are improving prospects for the covered barge market.
Commodities moved by covered barge are shown in Figure 3.
Grain Barge Freight Rates Recovering
The covered barge market is poised to have a great fall this year. The Illinois River barge freight rate has been elevated, running about 30 percent above the 5-year average since February this year as shown in Figure 4. The most current rate is 563 percent of tariff (a benchmark rate reflecting barge shipping costs).
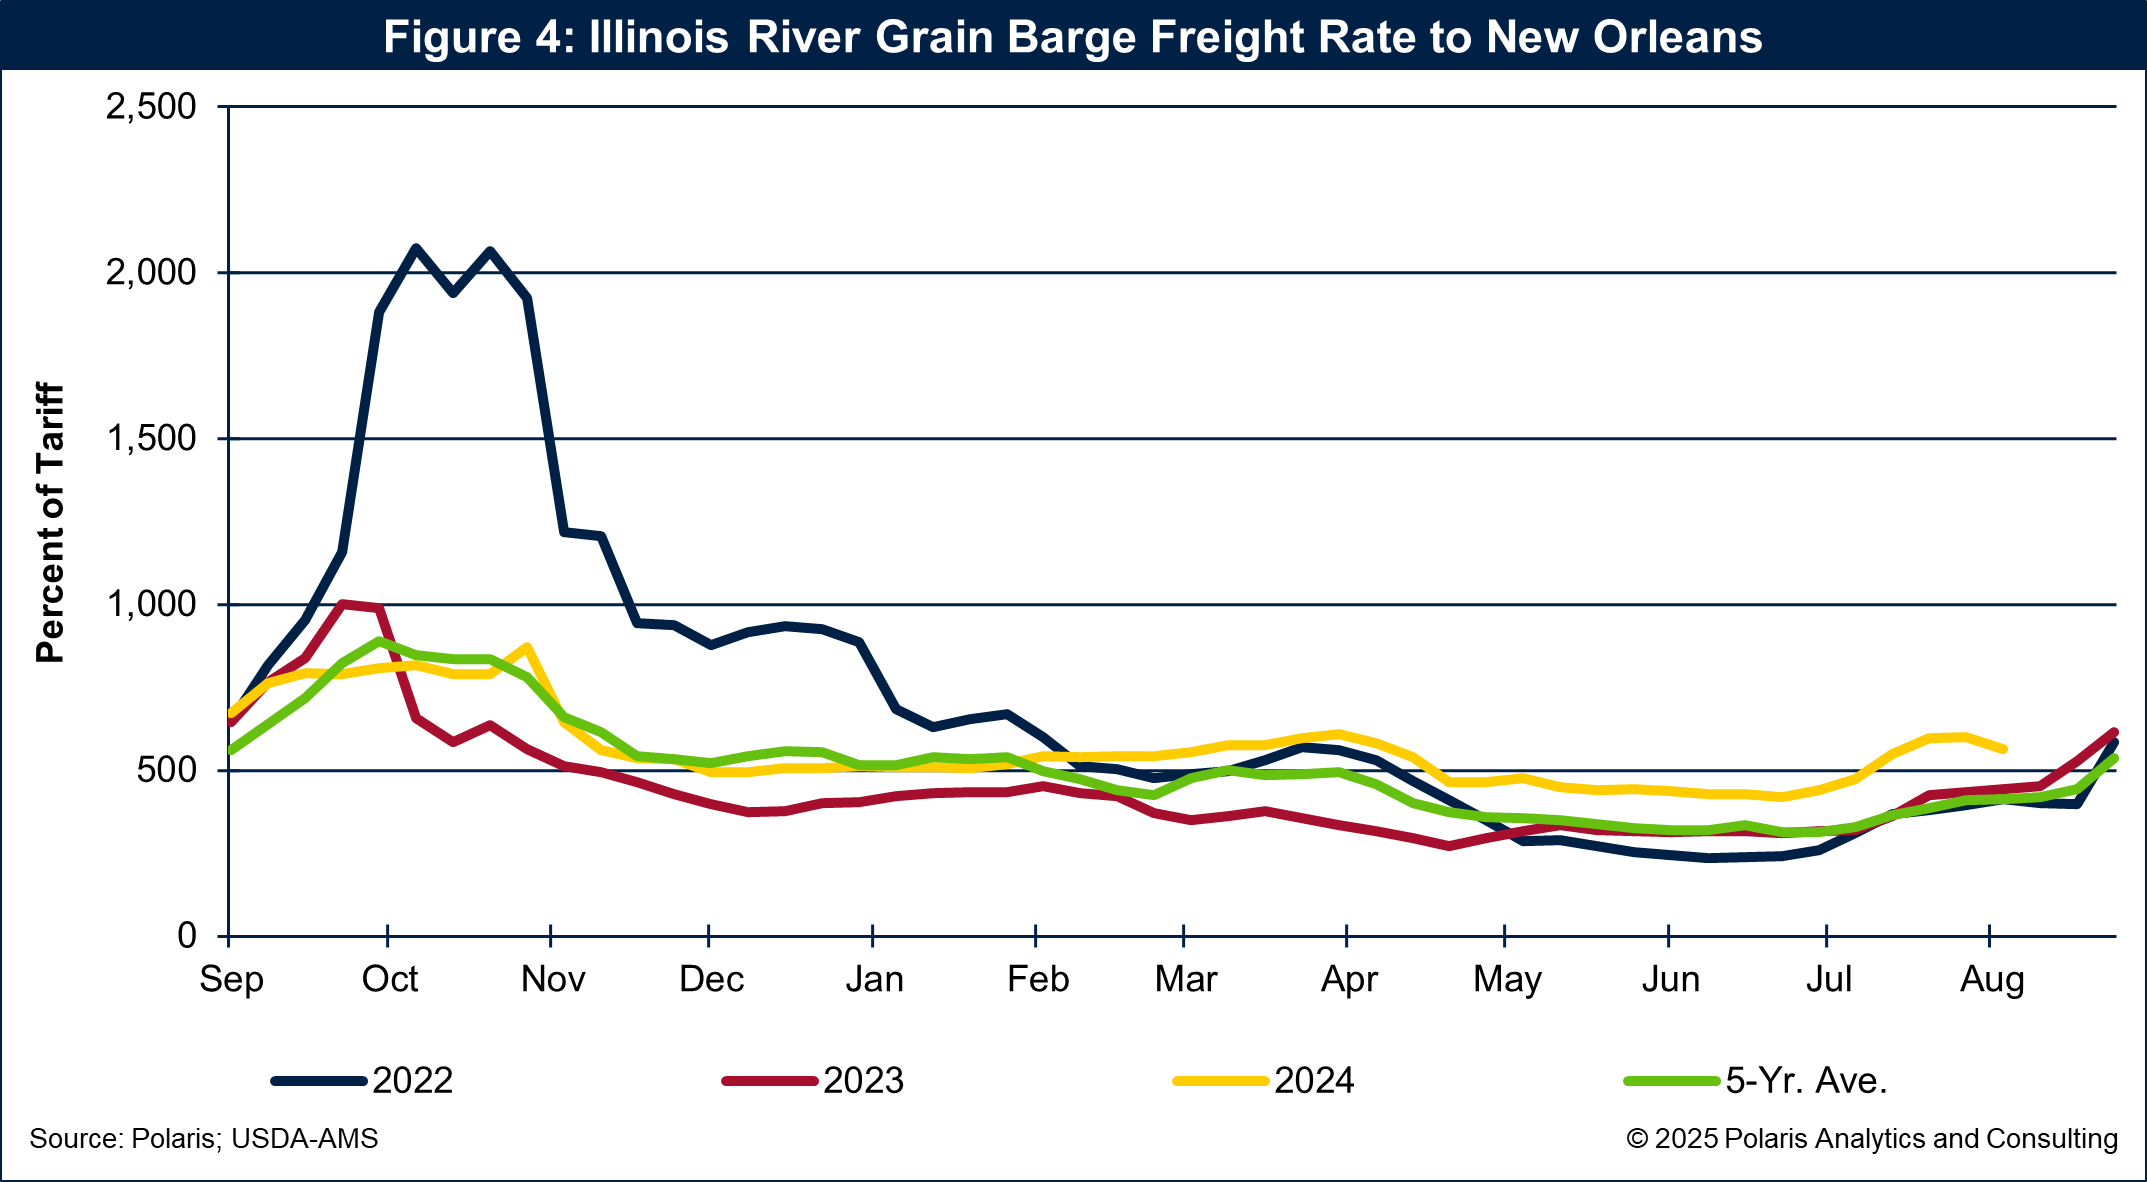
Deferred freight rates on the Illinois River are projected to hit a record 730 percent of tariff in September, with October rates climbing from 713 percent in early July to 791 percent by late July.
Strong barge movements depend on navigable water levels, currently above average at Memphis but subject to rapid changes. Any sudden drop in water levels will pressure barge freight rates and restrict movements of commodities by barge.
As grain exports surge, the covered barge market is poised for a robust recovery through 2026, provided that navigation conditions hold and that infrastructure is still resilient. Any impediments, such as low water, infrastructure failure or natural disasters, like a hurricane, will pressure the covered barge market at a time when volumes are rebounding and freight rates are firming.