
Horizons: Port Rankings And Missing Data Keep Industry Guessing
The U.S. Army Corps of Engineers Navigation and Civil Works Decision Support Center electronically published its 2024 Transportation Facts & Information card on July 31, 2026. That is a sneak peek at what happened on the water, now nearly two years ago. It is also, as of early September 2026, about all that is publicly available from the Corps for calendar year 2024. The full Waterborne Commerce of the United States manuscript files, port-by-commodity detail and origin-destination matrices that operators, ports, lenders and Congress use to underwrite steel, berths and lock chambers are still missing from the public library. The latest cargo and trips Excel files posted there remain those for 2023.
That lag is not a footnote. It is the story. Vessel operators and shippers must file origin-destination movements on ENG Form 3925 within 30 days after the close of the month under 33 CFR 207.800. The Corps tells those same filers that the data are “essential to justify the expenditures of federal funds for navigation project operations, maintenance, rehabilitation and improvement and for justifying the construction of new navigation projects.” The industry files on a 30-day clock. The scorekeeper is operating on something closer to a 19-month clock and counting.
At The Horizon: What The 2024 Fact Card Actually Shows
Start with the national frame. U.S. waterborne traffic totaled 2,335.6 million short tons in 2024, down 1.8 percent from 2023. Domestic internal traffic, the inland system that matters most to this special issue, was 437.7 million tons, down 2.5 percent. Coastwise domestic fell harder. Food and farm products were the bright line on an otherwise softer year: 327.7 million tons systemwide, up 12.6 percent, with internal farm and food traffic up 9.5 percent to 80.3 million tons. Coal, crude petroleum and sand-gravel-stone all moved the other way. Petroleum products remained the largest commodity group at 643.9 million tons, off 4.3 percent.
Domestic inland traffic generated 222.1 billion ton-miles at an average haul of 507 miles. The Mississippi River from Minneapolis to the Mouth of the Passes carried 260.1 million tons (down 1.6 percent) but 141.3 billion ton-miles (up 2.6 percent).
Tons eased; distance worked. That is a utilization story, not just a volume story, and it is exactly the kind of signal a port board or a barge line needs when it is deciding whether to add fleeting, deepen a berth or hold a hull.
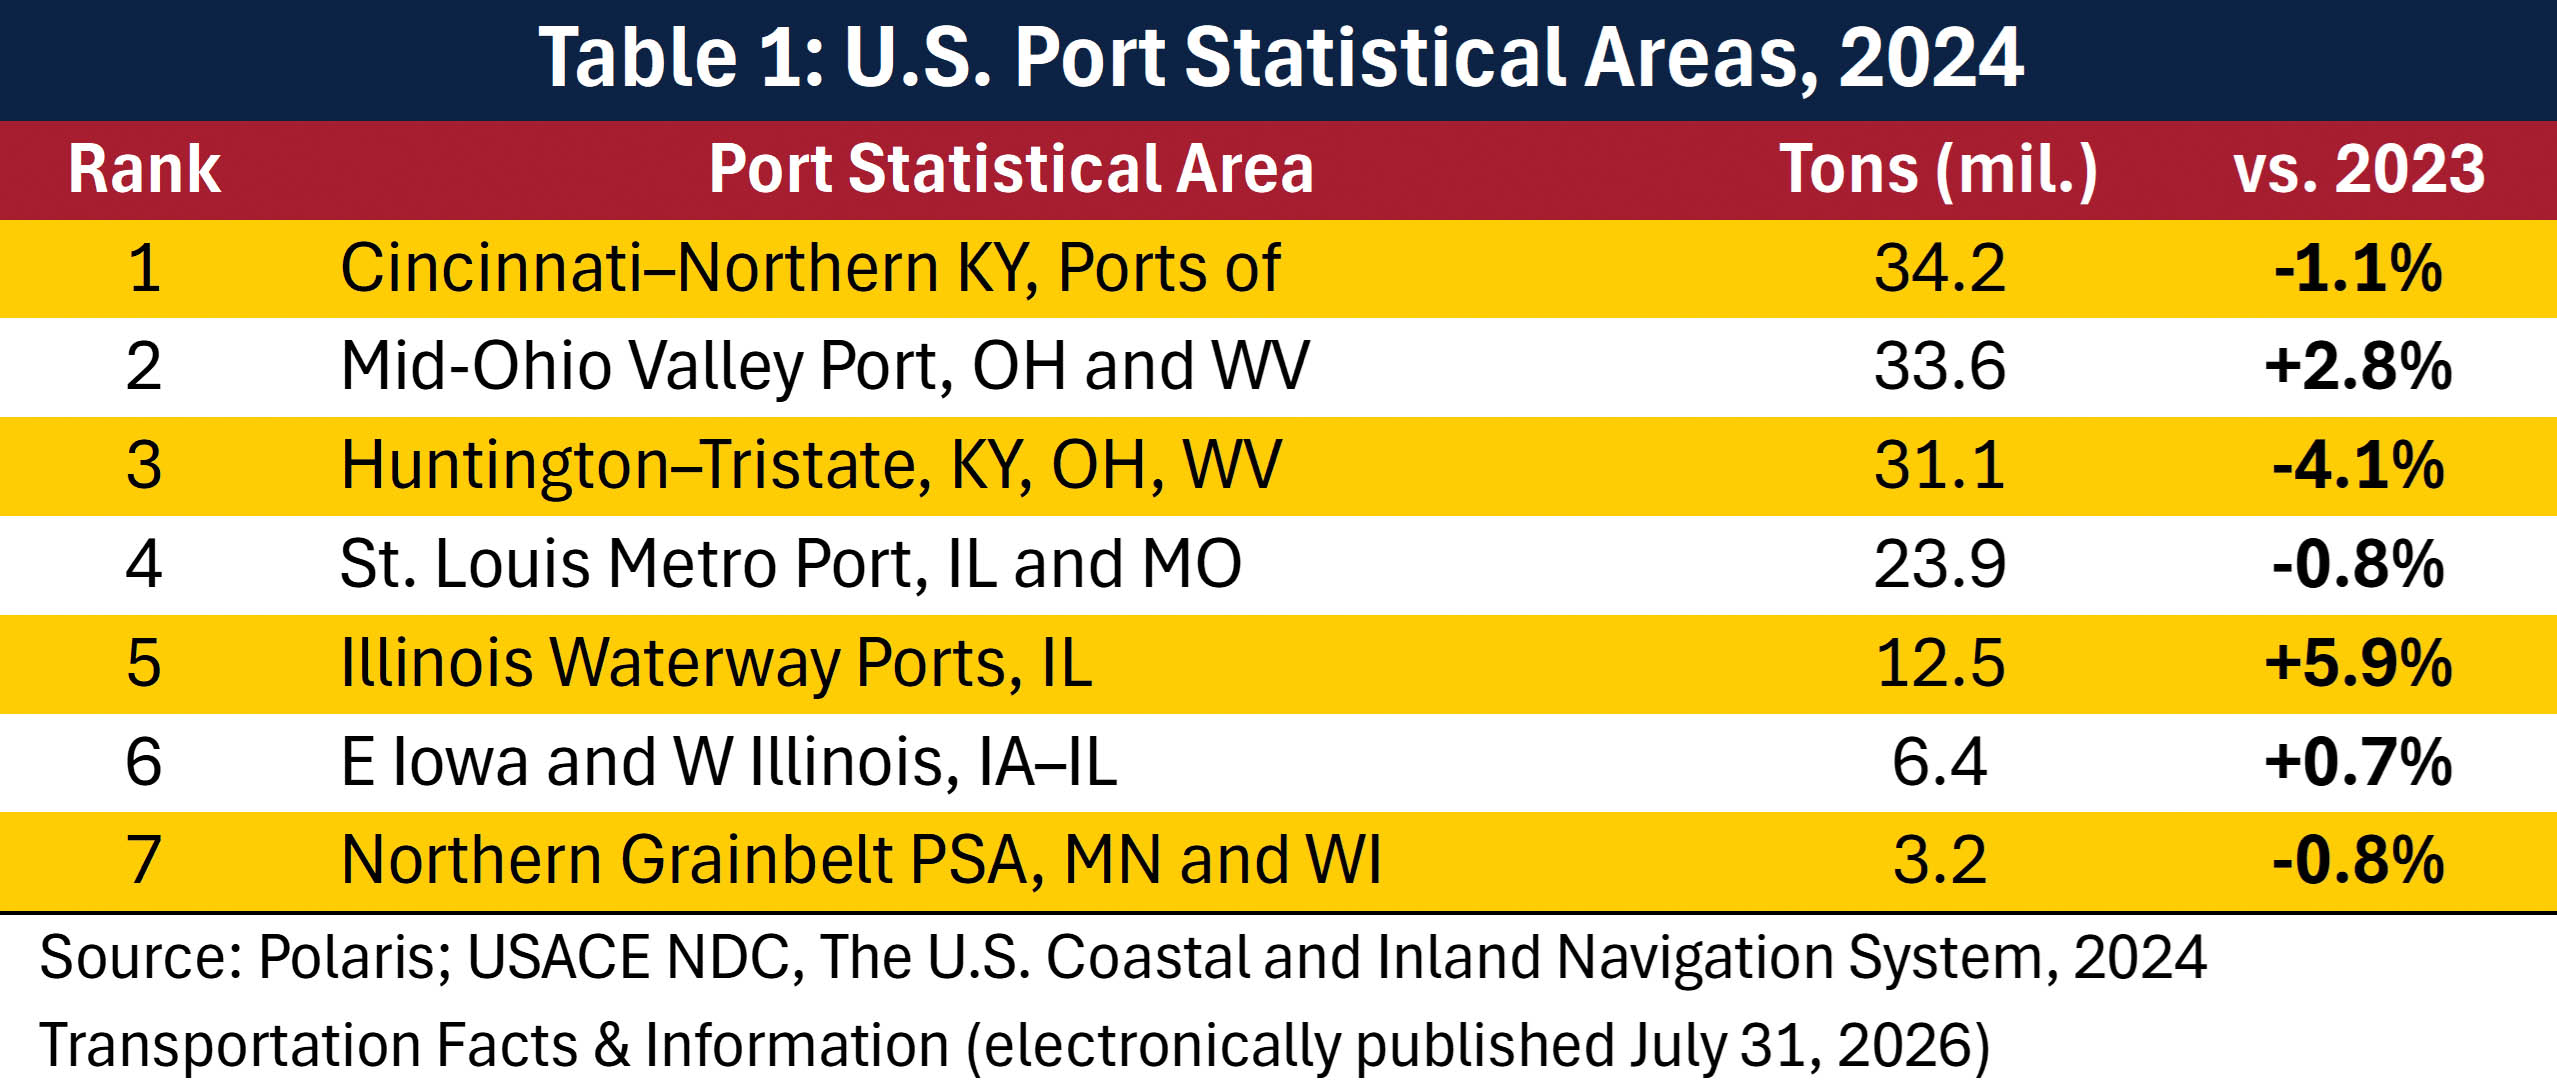
The Fact Card’s Port Statistical Area Table 1 is an inland table. Cincinnati–Northern Kentucky remains first at 34.2 million tons, off a modest 1.1 percent. Mid-Ohio Valley is the mover among the large PSAs, up 2.8 percent to 33.6 million tons. Huntington–Tristate slipped 4.1 percent to 31.1 million. St. Louis Metro was essentially flat. The Illinois Waterway Ports PSA posted the strongest gain among the published statistical areas, up 5.9 percent to 12.5 million tons, consistent with the Illinois Waterway itself, which rose 1.2 percent in tons and 2.4 percent in ton-miles.
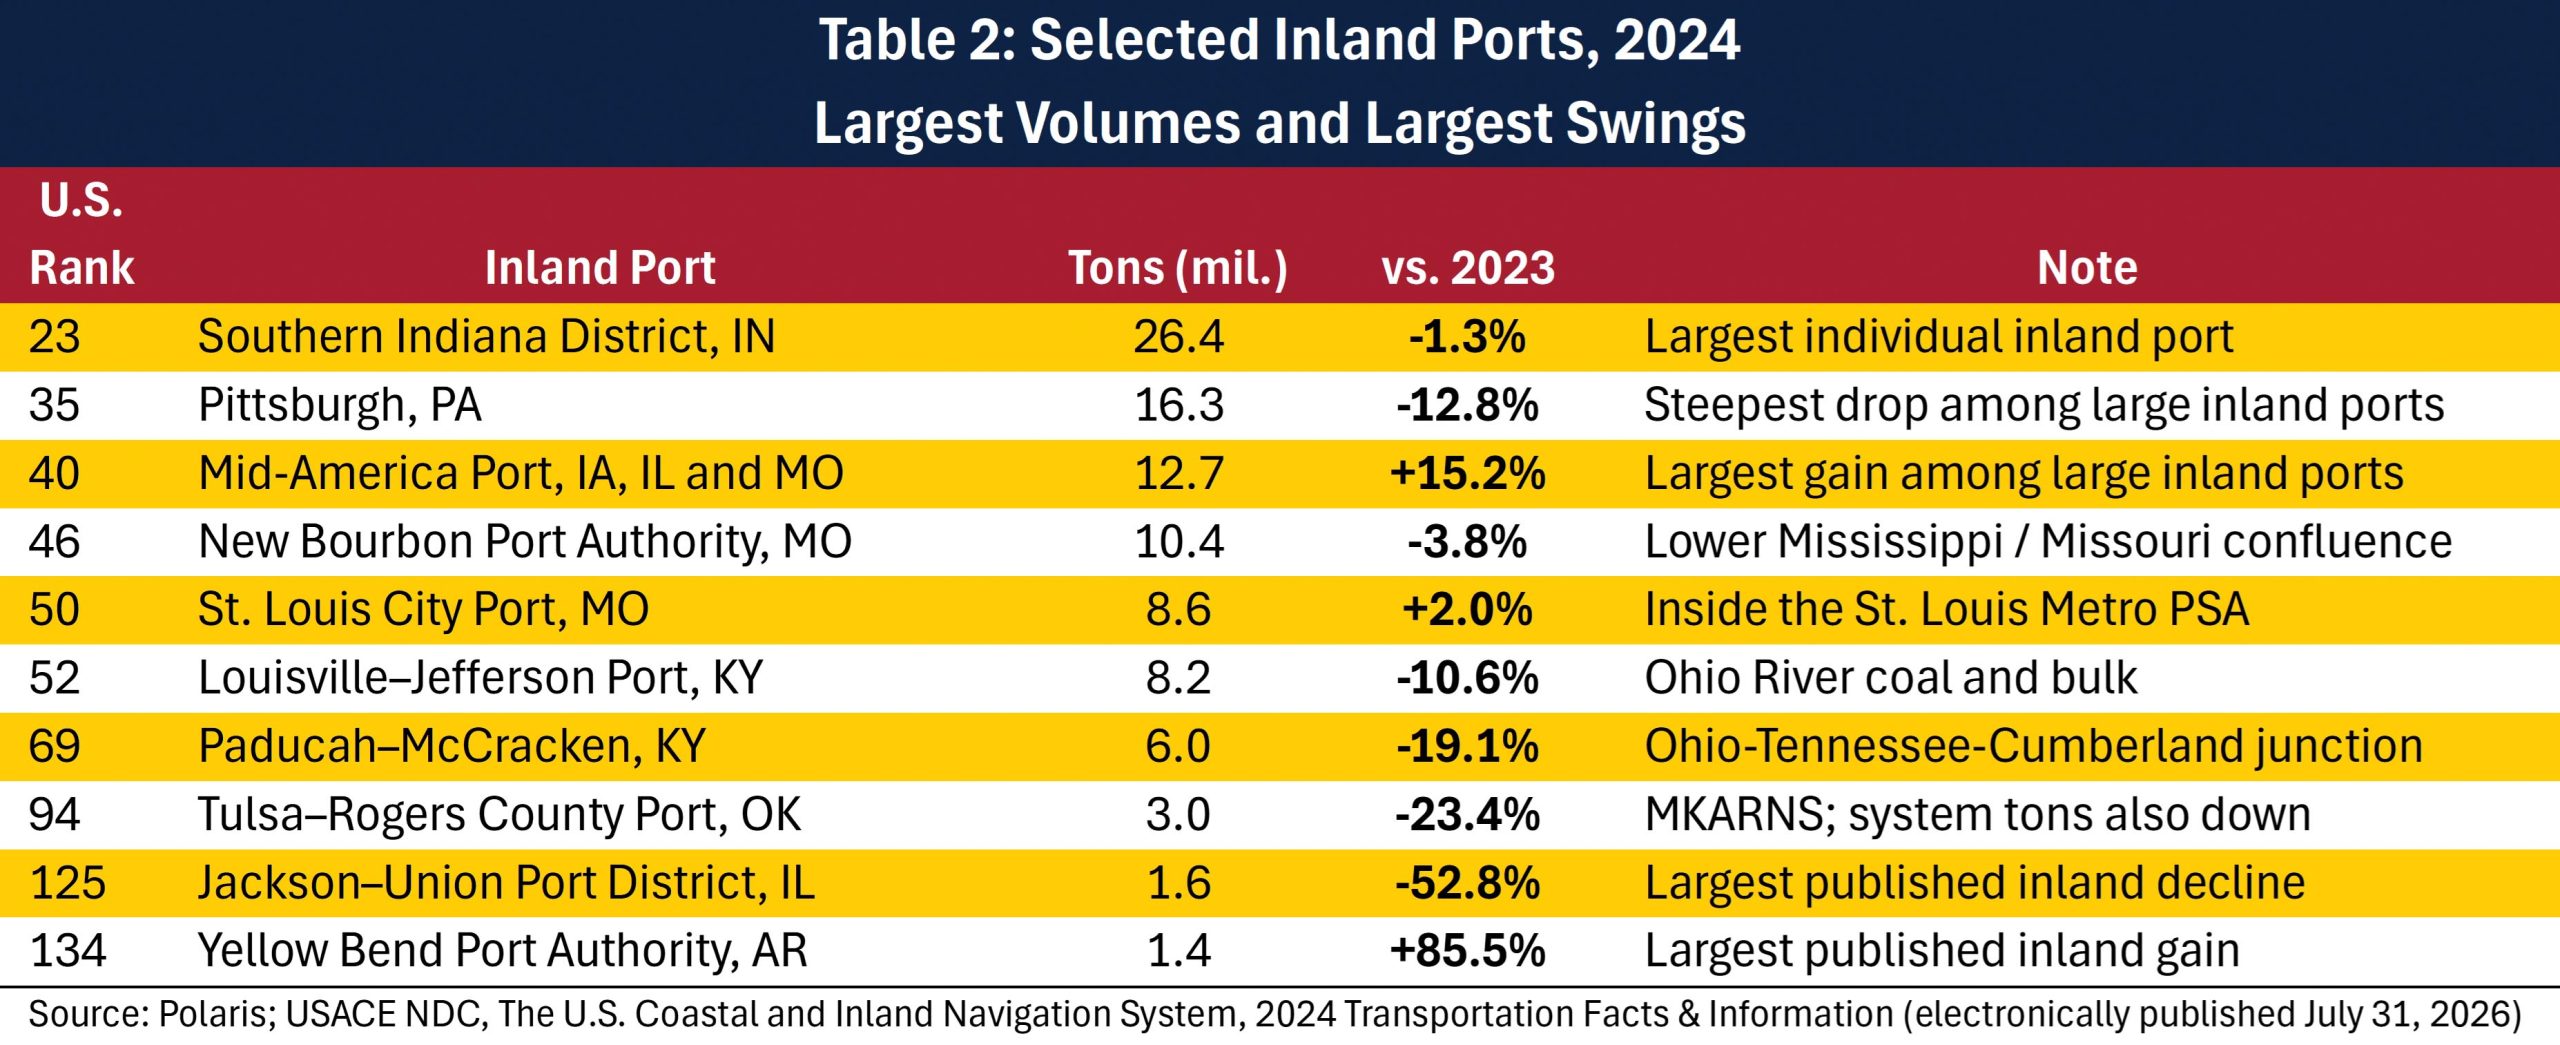
Those PSA numbers are aggregations. The Leading U.S. Ports list is where individual inland terminals show through. Among inland ports in the top 150, Southern Indiana District (itself a combination of three riverports) leads the published individual inland ports at 26.4 million tons, off 1.3 percent. Pittsburgh follows at 16.3 million tons, but down 12.8 percent, one of the steepest declines among large inland names. Mid-America Port (Iowa, Illinois and Missouri) is the standout among mid-sized inland ports: 12.7 million tons, up 15.2 percent as shown in Table 2.
Further down the list the percentage swings get large because the bases get small, but they still explain where the map is stretching. Yellow Bend, Ark., jumped 85.5 percent to 1.4 million tons. Shawneetown Regional Port in Illinois rose 33.7 percent. Pemiscot County, Mo.i, was up 26.3 percent. Helena–West Helena, Ark., gained 16.7 percent. Havana Regional Port and Heart of Illinois both posted mid-teens gains.
On the other side: Jackson–Union Port District, in Illinois, fell 52.8 percent; Tulsa–Rogers County dropped 23.4 percent on a McClellan-Kerr system that itself was down 8.8 percent in tons and 22.6 percent in ton-miles; Paducah–McCracken in Kentucky was off 19.1 percent; Memphis–Shelby in Tennessee off 11.9 percent; Joliet Regional in Illinois off 12.9 percent.
Gulf Coast And The Mississippi River System
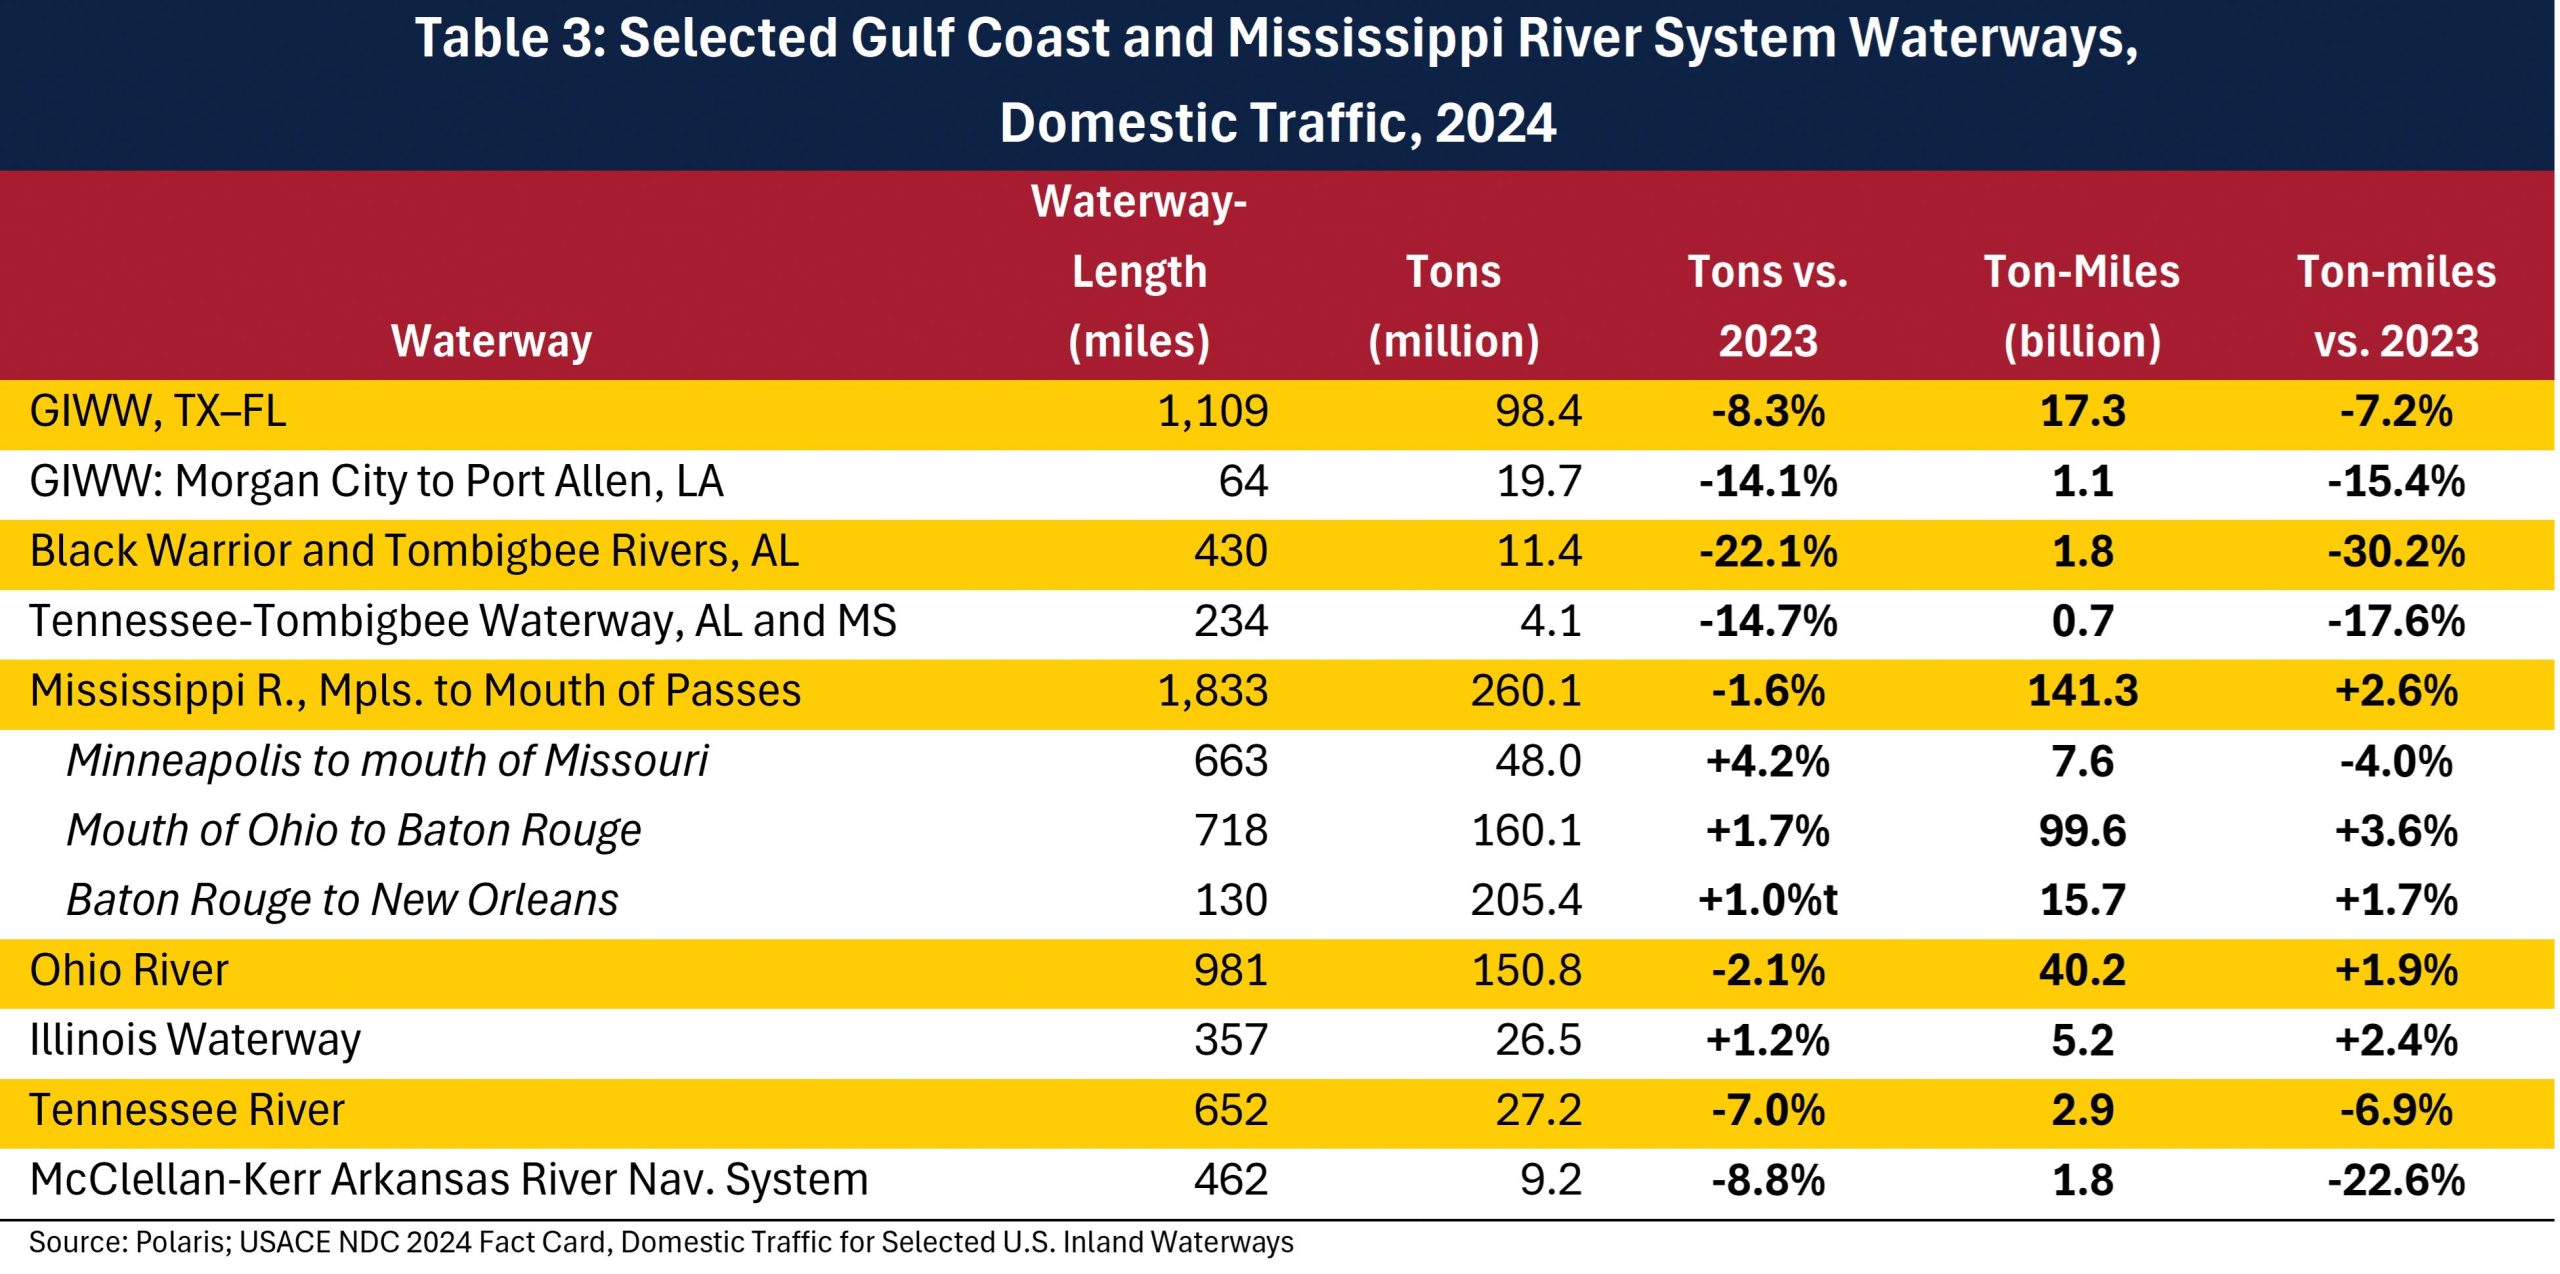
The Fact Card’s selected waterways table is the closest thing industry has to a 2024 system scorecard. Read it as two theaters.
On the Gulf Coast, the Gulf Intracoastal Waterway from Texas to Florida remains the workhorse at 98.4 million tons, down 8.3 percent, with 17.3 billion ton-miles, down 7.2 percent. The Morgan City-to-Port Allen reach of the GIWW fell 14.1 percent to 19.7 million tons. The Black Warrior and Tombigbee Rivers dropped 22.1 percent to 11.4 million tons and 30.2 percent in ton-miles, the statistical fingerprint of the January 2024 Demopolis Lock miter-sill failure that closed the lock for months and, with the Inner Harbor Navigation Canal outage, cut off an entire eastern inland artery. The Tennessee-Tombigbee Waterway was off 14.7 percent to 4.1 million tons. Those are not weather wiggles. They are infrastructure events written into the tonnage tape.
On the Mississippi River System, the picture is more mixed and more useful. The main stem from Minneapolis to the Mouth of the Passes eased 1.6 percent in tons and rose 2.6 percent in ton-miles. Segment by segment: Minneapolis to the mouth of the Missouri, 48.0 million tons, up 4.2 percent; mouth of the Missouri to the mouth of the Ohio, 88.0 million, up 0.8 percent; mouth of the Ohio to Baton Rouge, 160.1 million, up 1.7 percent; Baton Rouge to New Orleans, 205.4 million, up 1.0 percent; New Orleans to the Mouth of the Passes, 95.8 million, down 4.7 percent.
The Ohio River carried 150.8 million tons, down 2.1 percent, but 40.2 billion ton-miles, up 1.9 percent. The Illinois Waterway gained. The Tennessee River lost 7.0 percent. The Cumberland was off 2.5 percent. The Missouri River from its mouth to Sioux City fell 10.0 percent to 4.5 million tons. MKARNS, as noted, lost both tons and, more sharply, ton-miles.
Two other Fact Card numbers belong in any Ports and Terminals conversation. Corps and contractor dredges removed 233.6 million cubic yards in FY 2024 at a cost of $2.575 billion; maintenance was 76.8 percent of the yards, and private contractors moved 82.3 percent of the material. The Inland Waterways Trust Fund took in $123.4 million (including $106.6 million from the towing industry) and disbursed only $56.1 million for construction, ending the year at $332.2 million. The Harbor Maintenance Trust Fund equity stood at $10.1 billion. Industry is paying. The question is whether the data system that justifies the next dollar is keeping pace with the lock that just cracked.
On The Horizon: A 30-Day Filing Rule And A Two-Year Scoreboard
The Corps of Engineers requires vessel operators to submit Vessel Operation Reports within 30 days after the end of the month in which the movement occurred. Company-level detail is protected under the Trade Secrets Act. The Corps is the primary user. It also says the monthly indicators “support evaluations of project feasibility, inform investment priorities and guide the operation, rehabilitation and maintenance of navigation infrastructure.”
Sister federal agencies feel the lag, too. The Bureau of Transportation Statistics’ Port Performance Freight Statistics report has, in recent editions, still been forced to rank ports on Corps tonnage that is two or more years old even while it uses current-year figures from port authorities for other metrics. When the national scorekeeper is late, everyone else improvises.
Institute for Water Resources staff have said, and IWR leadership was on the copy and in agreement, that the Corps of Engineers has been “laser-focused over the past several weeks in completing the publication of the CY24 Waterborne Data, and in preparing the publication of the CY25 Waterborne Data (to be released later this CY).” That sentence raises the question the industry should ask out loud: will calendar year 2025 be released before the full complement of calendar year 2024 is on the street?
A Fact Card is not a manuscript file. A monthly indicator, useful as a nowcast, is not a certified origin-destination record. If CY25 summaries arrive while CY24 detail is still in the shop, the time series that every capital model depends on will have a hole in the middle.
This is not a new complaint. In this same Horizons column two years ago, the same lag was already a year and a half. NDC has been in a multi-year systems modernization, with a cloud-smart rebuild originally aimed at supporting 2026 processing. Modernization is necessary. It is not an excuse for leaving 2024 unpublished into the fall of 2026. The Corps can refuse a lockage to an operator who does not file. Industry does not have an equivalent lever when the agency that demanded the filing does not publish the result.
On The Horizon: Monthly Tape Broke, And BTS Republishes The Break
The monthly indicators were supposed to be the bridge while the annual file caught up. They are not a bridge if the planks do not match.
The Corps changed the Monthly Indicators methodology beginning in January 2026. The Waterborne Commerce Statistics Center describes the series as a nowcast: vessel-operation filings for the current calendar year combined with Lock Performance Monitoring System tonnages, run through linear-regression models for total commodities, coal, farm and food, chemicals and petroleum. As of March 2026, the Corps said those models had been “refined to improve predictive power and more closely align estimates with actual reported tonnages.” What it did not do is revise the published history for 2024 or 2025. The new model starts in January 2026. The old levels stay on the tape.
That is how a statistical change becomes a public confidence problem. The Bureau of Transportation Statistics does what a statistical agency should do: it republishes the Corps series. BTS’s seasonally adjusted “Tonnage for Internal U.S. Waterways,” carried on FRED as WATERBORNED11 and used in the Transportation Services Index, is a calculation from the Corps monthly indicators.
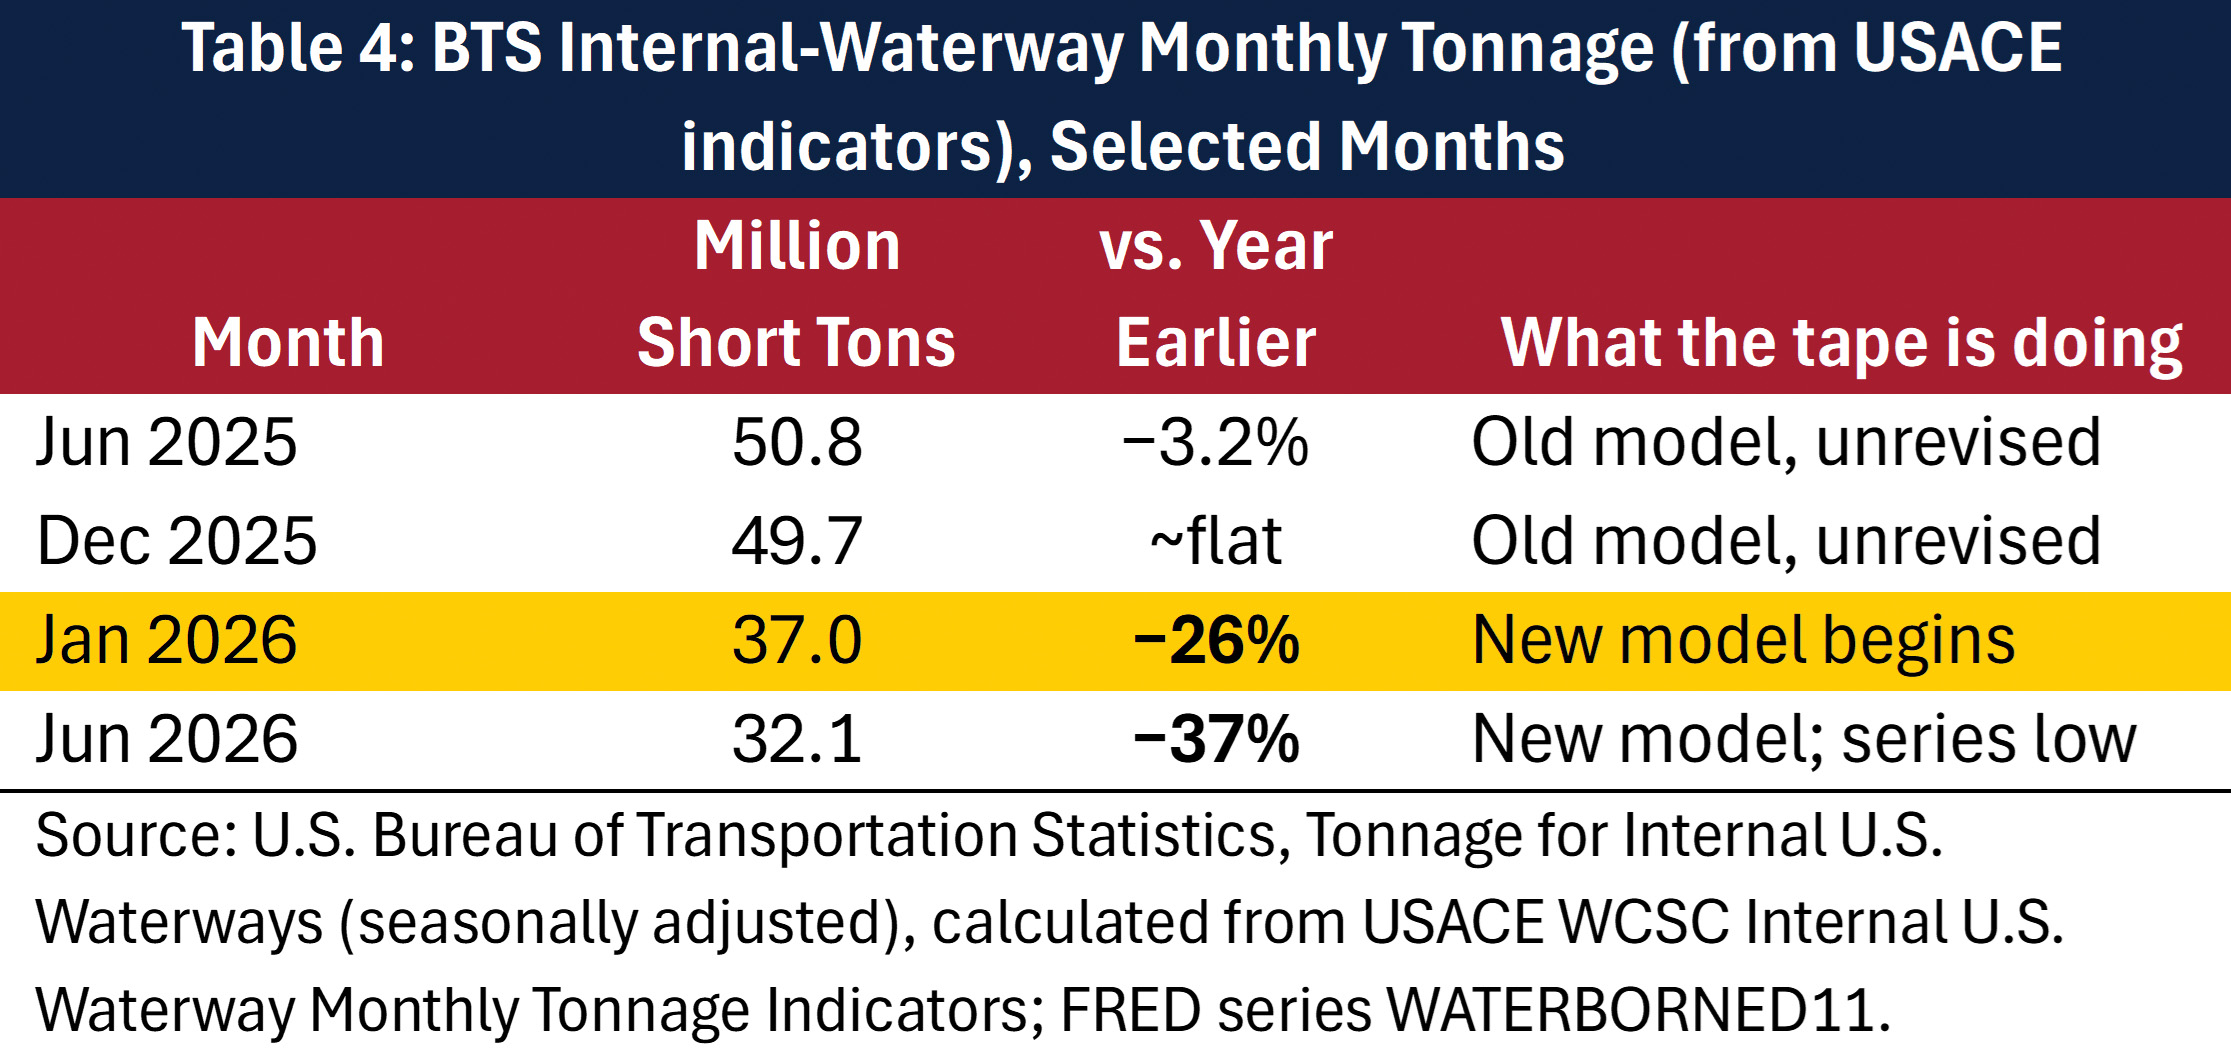
Through December 2025, that series sat near 50 million short tons a month. In January 2026, it dropped to about 37 million. By June 2026, it was 32.1 million, the lowest reading on the published history. Selected months from the Monthly Indicators report are displayed in Table 4.
No one who watches lock queues, grain bills or liquid barges believes the inland system lost a third of its cargo between Christmas and New Year’s. What changed was the model. Because the Corps did not revise 2024 and 2025 onto the new basis, the official monthly tape now has a cliff in it. Year-over-year comparisons from mid-2026 back to mid-2025 are not comparisons. They are a splice.
Users who work the 3925 filings and the lock tapes against those monthly levels will tell you the 2024 and 2025 indicator history is not close. In some reads it is off by on the order of nearly double. Even a coarser check should have raised a flag. The Fact Card’s own internal domestic total for 2024 is 437.7 million tons, about 36.5 million a month if you divide by 12. A monthly indicator sitting near 50 million through late 2025 was already telling a different story than the annual card the Corps has now posted. Leaving that history unrevised after a model change does not “more closely align estimates with actual reported tonnages.” It leaves two official numbers in the same building that cannot both be right, and it exports the contradiction to BTS, to FRED, to the TSI and to every analyst who treats a .gov series as gospel.
BTS is not the villain here. It should use what the Corps of Engineers posts. That is the point. When the source series is late, unrevised and internally inconsistent, the confusion multiplies. Ports defending a WRDA earmark, lenders sizing a fleeting loan and Hill staff writing a hearing memo are not going to reconcile LPMS, a Fact Card and a broken monthly tape. They will pick a number. Too often they will pick the wrong one. Confidence is the first casualty. Trust is the second. After that, the flawed data product is worse than no data at all because it looks official.
In mid-September the Navigation and Civil Works Decision Support Center put that choice in writing. As staffing at the center is “severely diminished” after retirements and exits, outputs are limited to products the Corps calls mandated under a Rivers and Harbors Act, WRDA or another statute. CY2024 WCUS and WTLUS are described as compiled and available, and the next posted target is CY2025 WCUS and WTLUS by December 2026, after which NDC will “reevaluate providing legacy data outputs.” That last phrase is the one to watch. Manuscript cargo, port-and-state, containers and foreign-cargo files are how a port district, a lender and a lock justification actually use the 3925 filings. If those files are now legacy, the 2021 public release schedule is not running late. It is being retired without a replacement calendar.
Who Owns The Lag? Three Places To Look—And One Tool Already On The Books
A constructive reading does not require a single villain. It does require someone to own the calendar.
One possibility is Congress. NDC and WCSC have been modernizing systems that were built 20 to 30 years ago. Cloud migration, geospatial rebuilds and the processing of tens of thousands of 3925 filings are not free. If the appropriation for data infrastructure is treated as overhead rather than as part of the navigation mission, the publication lag is a budget outcome. A lock that does not open makes the evening news. A data system that does not close the year does not. Members who write WRDAs and energy-and-water bills should ask whether the same Congress that demands a benefit-cost ratio for a new chamber has funded the commerce file that produces the ratio.
A second possibility is Corps leadership attention. Ribbon cuttings and news releases attach to groundbreakings, dredge launches and lock dedications. They do not attach to a manuscript file posted on time. If the incentive inside the building is visible concrete, the invisible ledger will wait. That is a choice, not a law of nature. The Corps already tells filers that their 3925 data justify federal expenditures. The same sentence is an argument for treating timely publication as a mission product, not a back-office chore. A commander who can schedule a hopper dredge can schedule a data release.
A third possibility is the carriers. Late, incomplete or sloppy Vessel Operation Reports will wreck any processing calendar. The Corps has said as much for years, and operators who live by the 30-day rule have a right to be irritated at operators who do not. But if late filing is the bottleneck, the regulation already gives the Corps the stick.
Under 33 CFR 207.800, failure to submit a timely, accurate and complete report is an offense. Criminal penalties run to a $5,000 fine or two months’ imprisonment per offense. Civil penalties, inflation-adjusted under 33 U.S.C. 555, now run to more than $7,000 per violation. The lockmaster or canal operator “can refuse to allow vessel passage.” The enforcement policy is not shy: “Every means at the disposal of the Army Corps of Engineers will be utilized to monitor and enforce these regulations.” The process is written down. The Chief of the Waterborne Commerce Statistics Center notifies the responsible party and allows 30 days to file after the fact. If the reports are not filed in that window, civil or criminal action is supposed to follow. Typical cases, the rule says, are willful, repeated or substantial-impact violations.
So the question is not whether Corps has recourse. It does. The question the industry and Congress should put on the record is whether the Corps has used it. Has the Corps penalized carriers for untimely or incomplete 3925 filings? If not, why not? If so, what was the response, how many notices went out, how many civil penalties were assessed, and did any lockage actually get refused? A public enforcement ledger would do more for filing discipline than another reminder in a district navigation notice. Silence on enforcement, paired with a two-year publication lag, reads the other way: the 30-day rule binds the industry on paper and binds the agency not at all.
None of those three explanations lets the others off. Congress can fund the upgrade and still need the Corps to publish. Leadership can care about data and still need carriers to file. Carriers can file on time and still need an agency that will close the year and revise a broken monthly tape. The constructive ask is modest. Publish the full CY24 file. Revise the 2024 and 2025 monthly history onto the January 2026 basis — or stamp those months “not comparable.” Tell BTS, in writing, when a splice is a splice. And say, on the record, whether the penalty tools in 207.800 have ever been picked up.
Over The Horizon: Decisions That Will Not Wait For The File
Ports, terminals, fleeting operators and equipment owners are making 20-year and longer investments with 2023 files, a 2024 postcard and a monthly series that fell off a cliff because the model changed. A 15 percent swing at Mid-America Port, a 13 percent drop at Pittsburgh, a 22 percent collapse on the Warrior-Tombigbee and an 85 percent jump at a small Arkansas harbor are the kinds of moves that change which berth gets the next shiploader and which lock chamber gets the next rehabilitation argument on the Hill. Without timely, accurate, publicly reconcilable data, those decisions get made on anecdotes, lock-queue screenshots and whatever a district will share off-book.
The approach at Polaris is to take the vast amount of data and transform it into a knowledge set that informs strategic outcomes. Delayed data is not a rounding error in that work. It is a missing input. A monthly indicator that cannot be compared with last year is not an input; it is noise with a federal seal. Investors cannot time a fleeting expansion. Port authorities cannot defend a WRDA ask with a two-year-old tonnage table and a spliced nowcast. Members of Congress cannot judge whether the system they fund is performing. The Corps itself, by its own regulation, cannot fully justify the next construction start if the commerce file is incomplete.
At the horizon, the 2024 Fact Card says inland volumes held better on the Mississippi main stem and the Illinois Waterway than on the Gulf feeder canals and the coal-facing Ohio tributaries, while farm and food products carried the year.
On the horizon, a promised CY24/CY25 publication burst will either close the gap or confirm that modernization is still eating the production calendar, and a monthly tape that was not revised for 2024 and 2025 will keep confusing anyone who borrows it.
Over the horizon, the risk is simple: capital, Congress and customers will keep guessing. Guessing is not a navigation policy.
Anchoring your future requires a scorekeeper that posts the game before the next season starts, and that does not change the rules at halftime without reprinting the first half.